
OEM International (OM:OEM B) Faces A Board Change As Valuation Questions Build
OEM International (OM:OEM B) moved into focus after Chair of the Board Christopher Norbye informed directors that he plans to step down. An Extraordinary General Meeting is set for mid October 2026.
At a share price of SEK181.2, OEM International has seen steady momentum, with a 30-day share price return of 4.5% and a 90-day gain of 8.63%. The 1-year total shareholder return of 27.33% and 3-year total shareholder return of 155.77% suggest investors have been rewarding the business over time, even as this board transition reshapes perceptions of future risk and leadership stability.
Scan beyond OEM International and review other industrials showing resilient momentum and leadership stability in our hand picked list of 227 resilient stocks with low risk scores.
OEM International now trades near recent highs after a strong run into this board change. The key question for investors is whether to commit capital at this level or wait for a cleaner entry as valuation comes into focus next.
Price-to-Earnings of 37.7x: Is it justified?
Valuation is front and center now that OEM International trades near SEK181.2 with a P/E of 37.7x that sits well above several reference points.
The P/E ratio compares the current share price to the most recent earnings per share and gives you a quick sense of how much investors are willing to pay for each unit of profit. For a technology trading group like OEM International, which sells automation components and industrial parts across Europe, this measure often reflects how much confidence the market has in the durability of its earnings profile.
- Relative to the European Trade Distributors industry average P/E of 18x, the current 37.7x suggests the market is assigning a much richer earnings tag to OEM International.
- Against a peer average P/E of 35.6x, the stock still trades at a premium, implying investors are paying more for each unit of earnings than they are for similar businesses.
- Compared to an estimated fair P/E of 21.6x, the current multiple is materially higher, which signals a valuation level that the market could eventually revert toward if expectations cool.
Given these gaps versus both industry and fair ratio estimates, the current P/E looks stretched rather than conservative for OEM International.
Explore the SWS fair ratio for OEM International.
Result: Price-to-Earnings of 37.7x (OVERVALUED)
Still, the rich 37.7x P/E for OEM International could come under pressure if the board transition unsettles sentiment or if recent revenue and net income growth rates slow.
Find out about the key risks to this OEM International narrative.
Another View on OEM International’s Value
The high 37.7x P/E paints OEM International as expensive, yet our DCF model lands in a different place. On that view, the shares at SEK181.2 sit about 1% below an estimated fair value of roughly SEK183.11. Two methods, two stories. Which one do you trust when committing fresh capital?
Look into how the SWS DCF model arrives at its fair value.
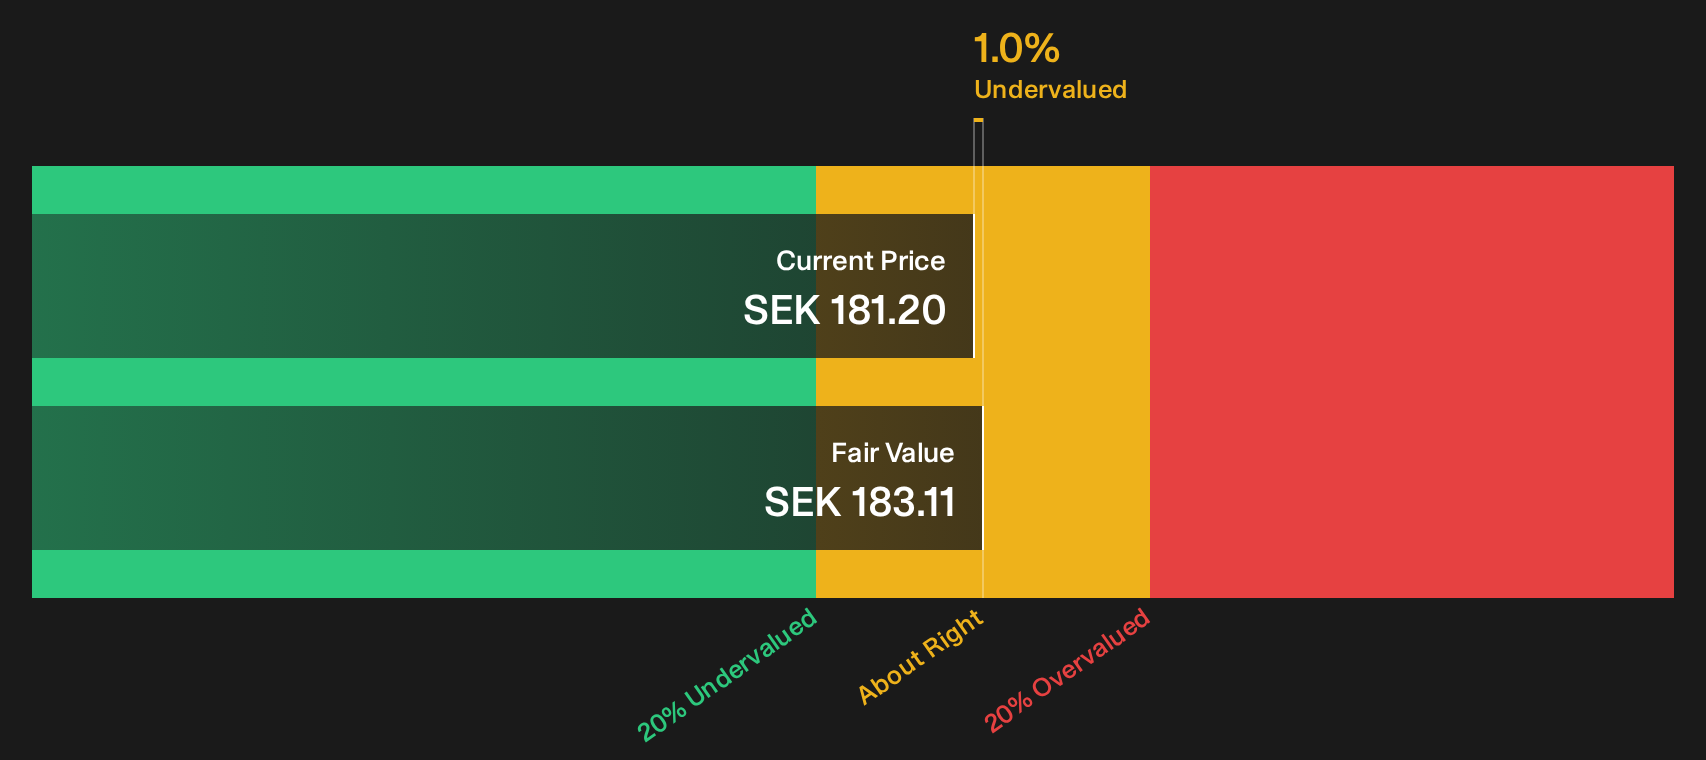
Simply Wall St performs a discounted cash flow (DCF) on every stock in the world every day (check out OEM International for example). We show the entire calculation in full. You can track the result in your watchlist or portfolio and be alerted when this changes, or use our stock screener to discover 182 high quality undervalued stocks. If you save a screener we even alert you when new companies match - so you never miss a potential opportunity.
Next Steps
Questioning whether the tone around OEM International is too cautious or not cautious enough today is a healthy instinct. Act quickly, review the underlying factors, and then test your own thesis against the 3 key rewards.
Looking for more OEM International style investment ideas?
If you are serious about sharpening your watchlist beyond OEM International, do not stop here. Use focused screeners to surface opportunities before the crowd catches on.
- Target potential mispriced opportunities by running a filter on companies that appear cheap relative to fundamentals using the 182 high quality undervalued stocks.
- Strengthen the defensive side of your portfolio by focusing on businesses with sturdy finances using the list of solid balance sheet and fundamentals (202 results).
- Hunt for lesser known prospects with strong underlying metrics that the market may be overlooking through the 620 high quality undiscovered gems.
This article by Simply Wall St is general in nature. We provide commentary based on historical data and analyst forecasts only using an unbiased methodology and our articles are not intended to be financial advice. It does not constitute a recommendation to buy or sell any stock, and does not take account of your objectives, or your financial situation. We aim to bring you long-term focused analysis driven by fundamental data. Note that our analysis may not factor in the latest price-sensitive company announcements or qualitative material. Simply Wall St has no position in any stocks mentioned.
Have feedback on this article? Concerned about the content? Get in touch with us directly. Alternatively, email editorial-team@simplywallst.com