
W. R. Berkley (WRB) Trades Below Fair Value, Is The Premium P E Still Too Rich?
W. R. Berkley (WRB) drew fresh attention after its recent close at US$66.82, which extends a share price decline over the past month and the past 3 months.
Over a longer lens, W. R. Berkley has produced a strong multi‑year total shareholder return, with the 3 year figure up 69.49% and the 5 year number up 127.54%. However, recent momentum has faded as the share price has slipped 4.53% over the past week and 6.24% over the past 3 months, leaving the 1 year total shareholder return down 9.48% despite that earlier compounding run.
Scan beyond W. R. Berkley and spot other insurers with shifting momentum by checking our hand picked 30 resilient stocks with low risk scores.
W. R. Berkley now trades below both analyst targets and an internal fair value estimate, despite that weaker recent run. Is this caution about the insurer’s earnings profile justified, or has the pullback gone too far?
Most Popular Narrative: 4% Undervalued
On the most followed narrative, W. R. Berkley screens slightly below its fair value estimate of $69.41 compared with the recent $66.82 close. This puts the focus squarely on how durable its underwriting and capital return profile really is.
The expanding complexity of global business and assets is driving demand for specialty insurance solutions. W. R. Berkley is building on this with mid single digit gross and net premium growth in its Insurance segment, alongside current accident year ex cat combined ratios around 89%, which can support revenue and underwriting income.
See why 6 investors see W. R. Berkley as 4% undervalued.
Result: Fair Value of $69.41 (UNDERVALUED)
Still, if softening commercial pricing squeezes underwriting margins or competition in property and reinsurance intensifies, the current W. R. Berkley valuation narrative could quickly look stretched.
Find out about the key risks to this W. R. Berkley narrative.
Another View on W. R. Berkley’s Valuation
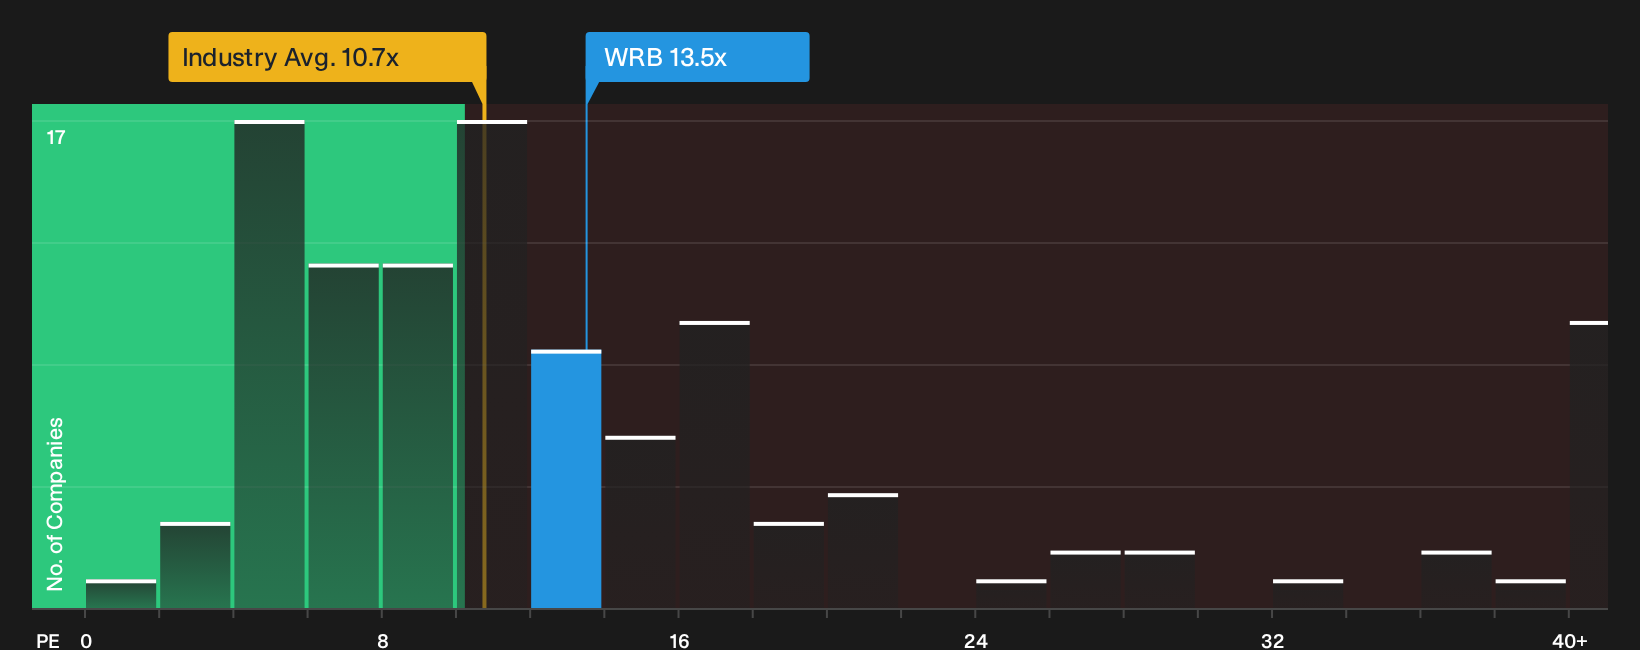
The earlier fair value discussion leans on analyst targets and earnings assumptions. If you look at simple pricing instead, the picture changes. W. R. Berkley trades on a P/E of 13.5x, compared with 10.6x for the US insurance sector and 9.5x for peers, while the fair ratio is 11x. That richer multiple increases the risk that any disappointment in earnings or pricing power could weigh more heavily on the share price than the DCF style narrative suggests. Which lens do you trust more when those expectations are already this tight?
See what the numbers say about this price in more depth by reviewing our valuation breakdown, then decide how much of a premium you are comfortable paying relative to peers and the fair ratio, See what the numbers say about this price — find out in our valuation breakdown.
Next Steps
Mixed signals around W. R. Berkley can leave you either cautious or curious, so move quickly, review the underlying data for yourself, and weigh both sides of the story with 2 key rewards and 2 important warning signs
Looking for more investment ideas beyond W. R. Berkley?
If W. R. Berkley has caught your eye, do not stop there. Broaden your watchlist now, because the most compelling opportunities rarely sit in plain sight.
- Target potential mispricing by scanning a curated set of quality opportunities through the 32 high quality undervalued stocks that line up strong fundamentals with compressed valuations.
- Strengthen your income tilt by reviewing the 8 dividend fortresses and focus on companies where higher yields come with robust underlying support.
- Prioritize financial resilience by filtering for companies on the list of solid balance sheet and fundamentals (24 results) that pair healthier leverage profiles with sound operating metrics.
This article by Simply Wall St is general in nature. We provide commentary based on historical data and analyst forecasts only using an unbiased methodology and our articles are not intended to be financial advice. It does not constitute a recommendation to buy or sell any stock, and does not take account of your objectives, or your financial situation. We aim to bring you long-term focused analysis driven by fundamental data. Note that our analysis may not factor in the latest price-sensitive company announcements or qualitative material. Simply Wall St has no position in any stocks mentioned.
Have feedback on this article? Concerned about the content? Get in touch with us directly. Alternatively, email editorial-team@simplywallst.com