
What Worthington Enterprises (WOR)'s Earnings And Dividend Affirmation Means For Shareholders
- Worthington Enterprises reported first quarter 2026 sales of US$343.89 million and net income of US$42.57 million, with basic EPS from continuing operations of US$0.88. The board affirmed a quarterly dividend of US$0.20 per share payable on December 29, 2026.
- The combination of higher sales and earnings, alongside a maintained cash payout, indicates management’s willingness to keep returning capital while supporting ongoing operations.
- The next step is to examine how Worthington Enterprises’ stronger quarterly earnings and affirmed dividend could influence the broader investment narrative.
Worthington Enterprises Investment Narrative Recap
To stay invested in Worthington Enterprises, you need to believe the current mix of Consumer and Building Products can keep supporting earnings while the firm pursues efficiencies and product expansion. The latest quarter shows the business generating higher sales and net income alongside better basic EPS, which supports that case but does not radically change the near term story.
The key short term swing factor remains how cost pressures, steel price moves, and consumer demand feed through to margins and equity earnings from joint ventures. Trade and macro risks, along with any M&A execution missteps, still look like the biggest threats to that earnings profile despite the solid quarter.
The most relevant update for this narrative is the board’s decision to declare a quarterly dividend of US$0.20 per share, payable on December 29, 2026. That decision sits alongside first quarter basic EPS from continuing operations of US$0.88 and net income of US$42.57 million, which gives you a snapshot of current earnings support for cash returns.
For an investor following Worthington Enterprises, that payout level ties directly into the catalyst of using a relatively low leverage balance sheet to fund both distributions and growth projects. The dividend also highlights a practical risk. If tariffs, weaker consumer sentiment, lower steel prices, or a difficult acquisition stretch margins, management could have less room to keep funding both expansion and regular cash returns at the same time.
Worthington Enterprises Earnings Assumptions and Valuation Bridge
Analysts are sketching a medium term path for Worthington Enterprises that links today’s profitability to their 2029 targets for both revenue and earnings. The forecast calls for revenue growth of 4.3% a year, with current earnings of US$163.5 million projected to reach US$225.6 million by 2029. That implies an earnings increase of about US$62 million over the period, supported by an expected lift in profit margins and a modest reduction in share count.
Worthington Enterprises' narrative points to forecast revenues of US$1.6b and projected earnings of US$225.6 million by 2029. This setup assumes 4.3% yearly revenue growth and an earnings increase of about US$62 million from current earnings of US$163.5 million.
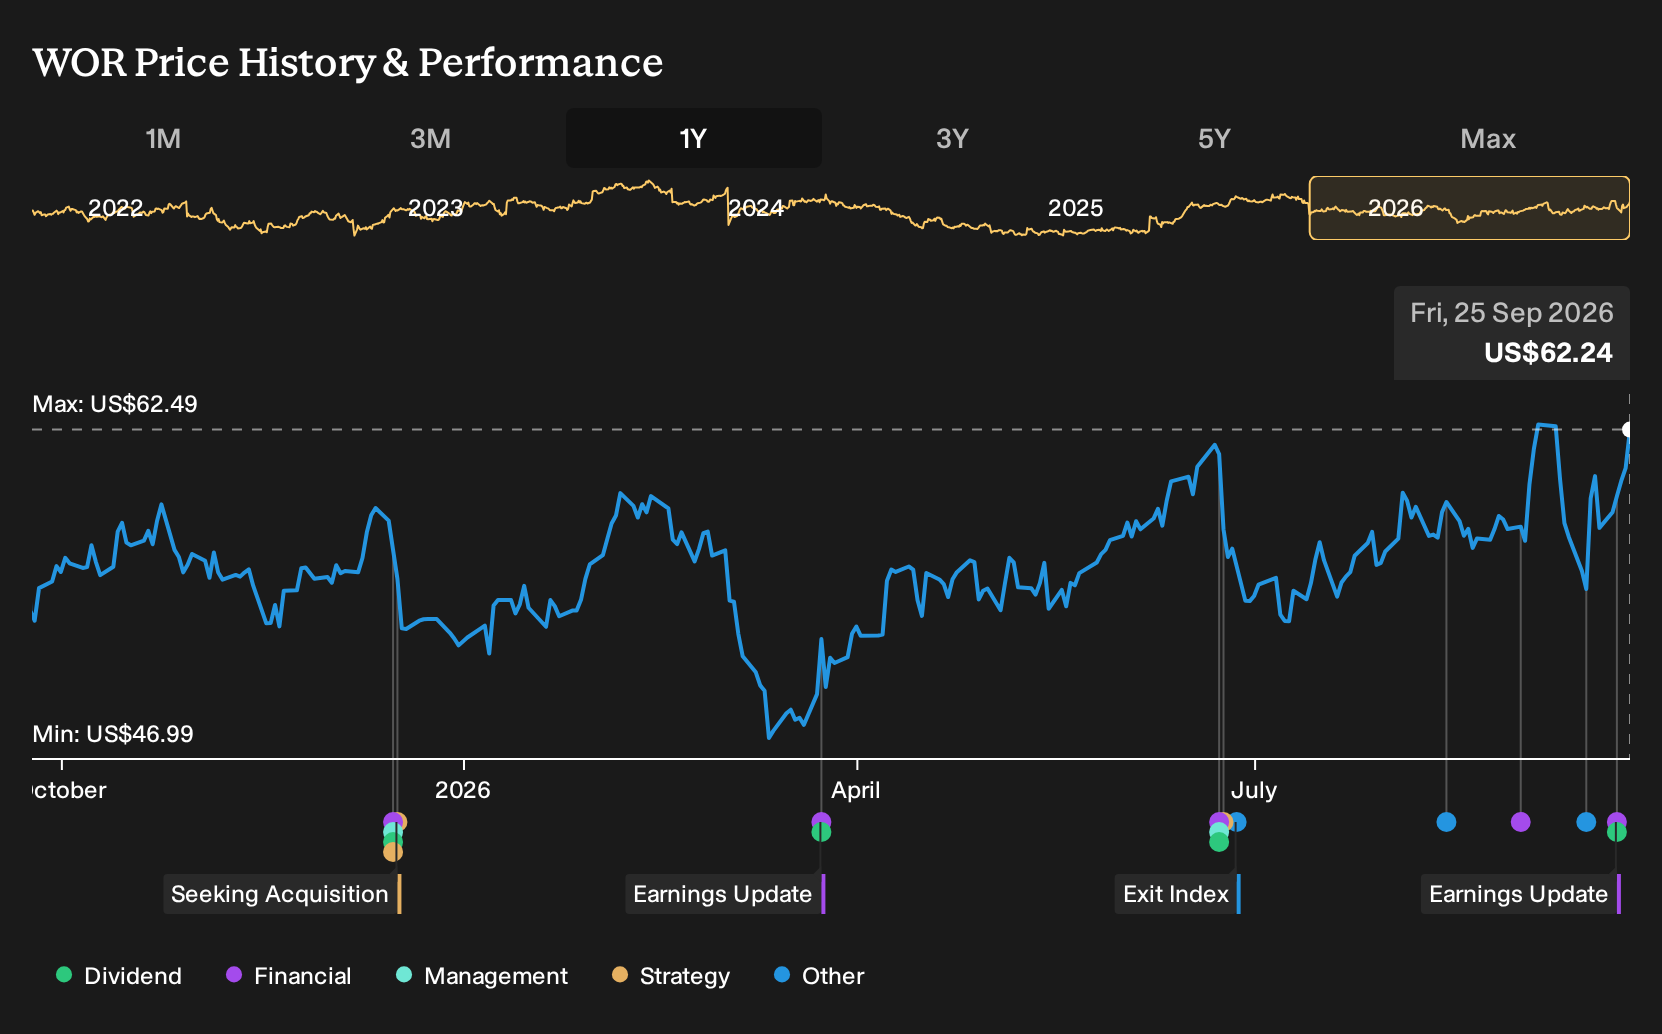
Those projections then feed into the analysts’ valuation framework for Worthington Enterprises. To line up with the price targets, the stock would need to trade on a P/E of 17.9x in 2029 based on the US$225.6 million earnings estimate. This compares with a reported multiple of 18.1x today and an industry level of 24.4x for US Machinery. The consensus target of US$69.20, versus a recent share price of US$60.33, reflects that set of assumptions on margins, revenue progress, and discount rate rather than a simple extrapolation of the latest quarter.
For you as an investor, the key question is not whether those precise numbers will play out, but whether the basic story feels reasonable. That story links a forecast move in margins from 11.5% to 14.0%, 4.3% annual revenue growth, and earnings of US$225.6 million in 2029 with a slightly lower P/E multiple than today. If your own expectations on revenue run rate, profit conversion, and balance sheet risk sit below those analyst assumptions, the implied upside to the stock from the consensus target may look less compelling. If your view is more optimistic on Consumer and Building Products demand or on the payoff from acquisitions, then the same framework could look conservative.
It is also worth keeping the range of analyst views in mind rather than focusing only on the average. The highest price target of US$76 and the low end of US$50 bracket a wide spread of opinions on how Worthington Enterprises will handle steel price swings, customer credit quality, and integration of deals like Ragasco. That dispersion signals that the earnings path to US$225.6 million is not a straight line, and that outcomes on tariffs, consumer confidence, and project execution could shift the equity story meaningfully in either direction.
Uncover how Worthington Enterprises' fair value indicates an 11% potential upside to its current price before the gap closes.
Exploring Other Perspectives
One alternate view on Worthington Enterprises focuses on trade protectionism as the swing factor. The most bearish analysts were assuming revenue of about US$1.6b and earnings of US$212.9 million by 2029, on a lower 13.8x P/E. That is a much more cautious story than consensus, and the fresh Q1 results and affirmed dividend might eventually shift it.
Explore another Worthington Enterprises fair value estimate, including one that suggests it could be worth just $69.20.
Form Your Own Verdict
Don't just follow the ticker. Dig into the data and build a conviction that's truly your own.
- A great starting point for your Worthington Enterprises research is our analysis highlighting 3 key rewards that could impact your investment decision.
- See our latest analysis for Worthington Enterprises. The report includes a comprehensive fundamental analysis summarized in a single visual, the Snowflake, making it easy to evaluate Worthington Enterprises' overall financial health at a glance.
Looking for more investment ideas beyond Worthington Enterprises?
Once you understand where Worthington Enterprises fits in your portfolio, it can help to compare it with a few other stocks that share similar income, quality, or risk profiles. The Simply Wall St Screener lets you move from a single ticker to a broader watchlist that matches the way you like to invest.
- If you value resilient cash flows and want potential ideas with strong income support, start with a curated set of 8 dividend fortresses that prioritise consistent distributions.
- For investors who care most about balance sheet strength and fundamentals, filter for businesses on the list of solid balance sheet and fundamentals (24 results) and see which ones line up with your risk comfort.
- If you prefer to look where fewer people are paying attention, scan a focused group of 16 high quality undiscovered gems that combine quality markers with relatively limited coverage.
This article by Simply Wall St is general in nature. We provide commentary based on historical data and analyst forecasts only using an unbiased methodology and our articles are not intended to be financial advice. It does not constitute a recommendation to buy or sell any stock, and does not take account of your objectives, or your financial situation. We aim to bring you long-term focused analysis driven by fundamental data. Note that our analysis may not factor in the latest price-sensitive company announcements or qualitative material. Simply Wall St has no position in any stocks mentioned.
Have feedback on this article? Concerned about the content? Get in touch with us directly. Alternatively, email editorial-team@simplywallst.com