
How Investors May Respond To Match Group Stock As Hinge Growth Accelerates
- Match Group reported that Hinge revenue rose 22% year over year and adjusted EBITDA increased 48%, supported by higher global MAUs and expansion markets.
- The business is leaning on Hinge momentum while pushing a product-focused turnaround at Tinder, including new recommendation algorithms and an expanded Events footprint targeting 75 cities.
- We will now look at how Match Group's investment narrative could shift in light of Hinge's rapid expansion and profitability gains.
Scan beyond Match Group and see how other app driven platforms are priced for user growth and profitability using our hand picked 16 high quality undiscovered gems.
Match Group Investment Narrative Recap
To own Match Group, you need to believe its portfolio can keep converting online dating habits into steady paying usage across Tinder, Hinge and the rest of the apps. The latest Hinge update, with 22% revenue growth and a 48% jump in adjusted EBITDA, supports that idea of a multi brand engine, even as total Q3 revenue is guided to be slightly lower year over year.
The key near term swing factor is whether Tinder’s product refresh and Events rollout stabilise payers after earlier declines. That remains uncertain, which keeps execution risk high, especially given Match Group’s reliance on Tinder and the added pressure from higher debt and negative shareholders’ equity.
The most relevant update here is management’s Q3 revenue outlook of US$885 million to US$895 million, which implies a small year over year dip despite strong Hinge numbers. That guidance ties directly to the near term catalyst, which is whether product changes at Tinder and a redesign impact at Azar weigh on payer trends and spending more than expected.
For you as a shareholder, this means watching two things at once. Hinge’s traction speaks to the upside case of better mix and margins across the group. The softer near term revenue guide highlights the risk that product shifts, competition and monetisation tweaks can interrupt that story if Tinder and the smaller brands do not absorb change smoothly.
Match Group's current narrative points to revenues of US$4.0b and earnings of US$860.9 million by 2029, based on analyst assumptions of 4.2% yearly revenue growth and an earnings increase of about US$153 million from US$707.8 million today.
Uncover why Match Group's fair value indicates a 3% potential upside to its current price that may not last much longer.
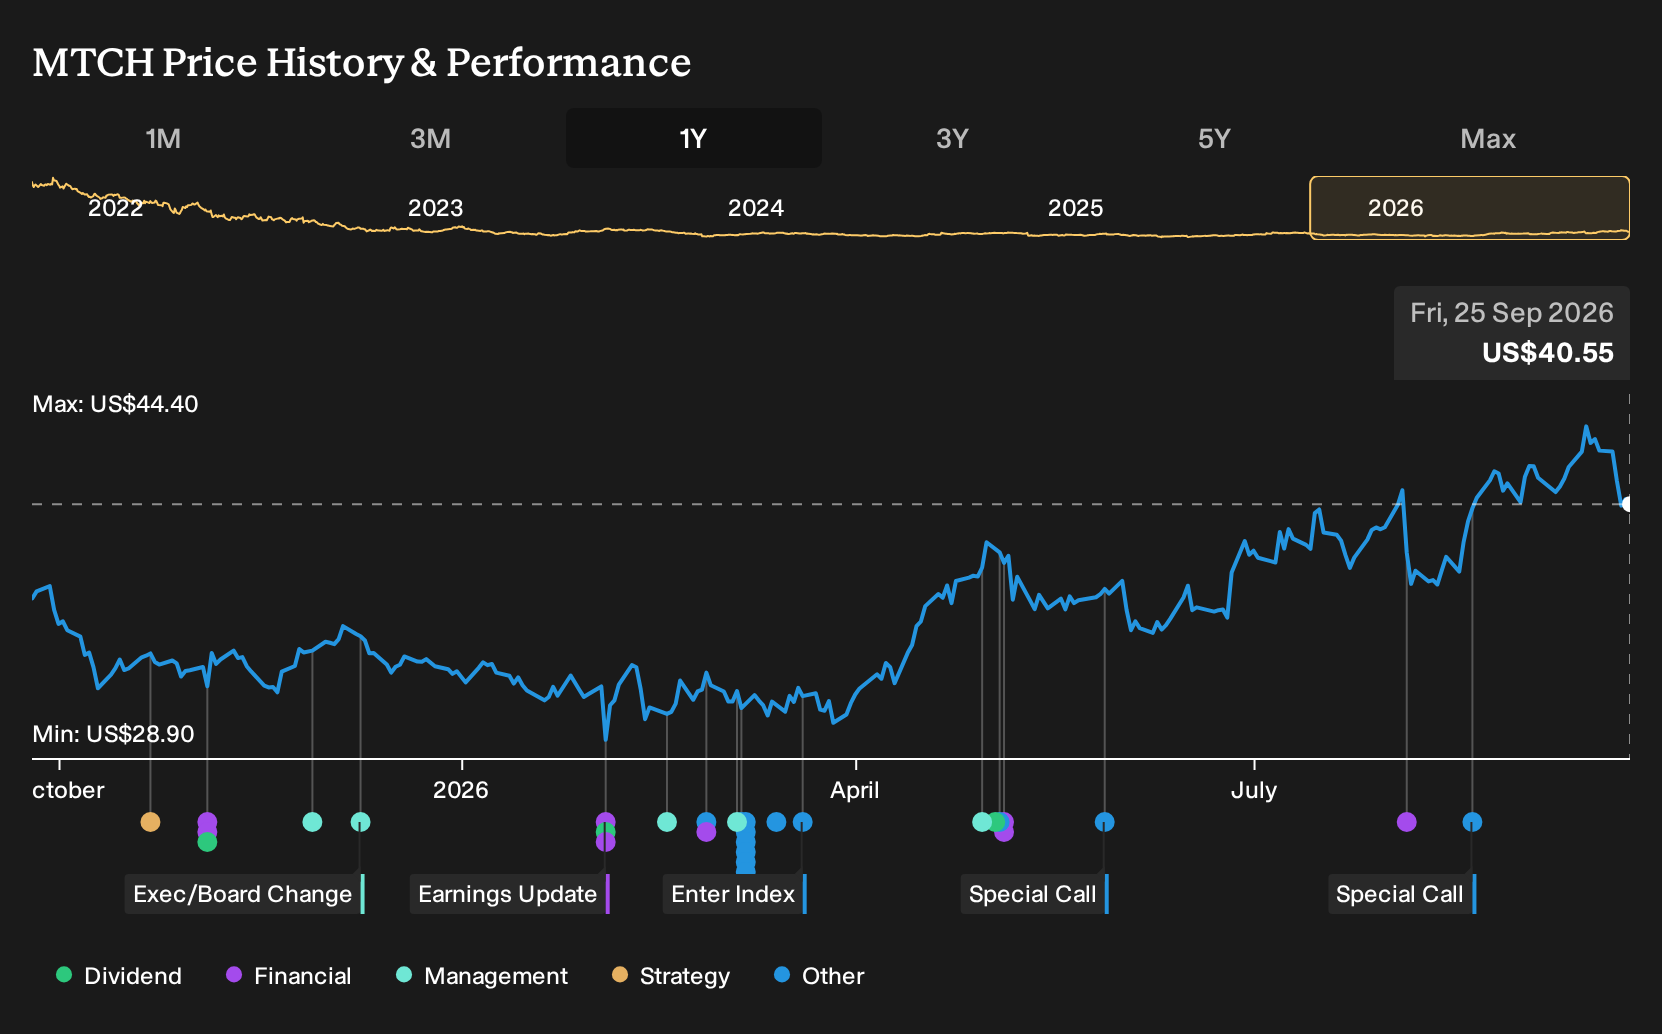
Exploring Other Perspectives
One alternative angle on Match Group focuses on the upside from premium offerings. The most optimistic analysts, working off pre news estimates, were expecting revenue to reach about US$4.1b and earnings of US$878.8 million by 2029. That is far more upbeat than consensus, so it is worth comparing these competing stories yourself.
Explore 4 other Match Group fair value estimates, including one that suggests potential upside of up to 119% from the current price!
Reach Your Own Conclusion
Don't just follow the ticker; dig into the data and build a conviction that's truly your own.
- A great starting point for your Match Group research is our analysis highlighting 3 key rewards and 3 important warning signs that could impact your investment decision.
- See our latest analysis for Match Group. The report includes a comprehensive fundamental analysis summarized in a single visual, the Snowflake, making it easy to evaluate Match Group's overall financial health at a glance.
Looking For More Investment Ideas Beyond Match Group?
If the Match Group story has sharpened your thinking, use that momentum to scan a wider field of opportunities with the Simply Wall St screener and line up a watchlist that actually fits your preferences.
- If you want income and staying power, start with companies that combine higher yields with resilient business models using our hand picked 8 dividend fortresses.
- If value is your focus, narrow in on financially strong businesses trading below what their fundamentals might justify by running a filter built around 32 high quality undervalued stocks.
- If capital protection comes first, concentrate on steadier profiles with healthier balance sheets and lower risk scores by scanning our curated 30 resilient stocks with low risk scores.
This article by Simply Wall St is general in nature. We provide commentary based on historical data and analyst forecasts only using an unbiased methodology and our articles are not intended to be financial advice. It does not constitute a recommendation to buy or sell any stock, and does not take account of your objectives, or your financial situation. We aim to bring you long-term focused analysis driven by fundamental data. Note that our analysis may not factor in the latest price-sensitive company announcements or qualitative material. Simply Wall St has no position in any stocks mentioned.
Have feedback on this article? Concerned about the content? Get in touch with us directly. Alternatively, email editorial-team@simplywallst.com