
3 Global Stocks Estimated To Be Undervalued By Up To 48.1%
In recent weeks, global markets have been navigating a complex landscape marked by concerns over inflation and rising interest rates, with notable strength in sectors like information technology amid the excitement surrounding AI advancements. As investors seek opportunities in this fluctuating environment, identifying undervalued stocks becomes crucial; these are stocks that may offer potential value relative to their current market price and could benefit from broader economic trends and sector-specific developments.
Top 10 Undervalued Stocks Based On Cash Flows
| Name | Current Price | Fair Value (Est) | Discount (Est) |
| RaySearch Laboratories (OM:RAY B) | SEK174.30 | SEK343.77 | 49.3% |
| Rakus (TSE:3923) | ¥1033.50 | ¥2062.91 | 49.9% |
| KSB SE KGaA (XTRA:KSB) | €884.00 | €1755.45 | 49.6% |
| Koninklijke BAM Groep (ENXTAM:BAMNB) | €11.92 | €23.07 | 48.3% |
| Kingnet Network (SZSE:002517) | CN¥16.17 | CN¥31.44 | 48.6% |
| Hanza (OM:HANZA) | SEK149.00 | SEK287.32 | 48.1% |
| Dongwon Industries (KOSE:A006040) | ₩36050.00 | ₩70678.77 | 49% |
| China Coal Energy (SEHK:1898) | HK$10.43 | HK$20.08 | 48.1% |
| Boliden (OM:BOL) | SEK521.00 | SEK1013.09 | 48.6% |
| Apator (WSE:APT) | PLN24.80 | PLN48.79 | 49.2% |
Underneath we present a selection of stocks filtered out by our screen.
Burjeel Holdings (ADX:BURJEEL)
Overview: Burjeel Holdings PLC, along with its subsidiaries, operates multi-specialty hospitals and medical centers across the United Arab Emirates, Oman, and Saudi Arabia, with a market cap of AED5.99 billion.
Operations: The company's revenue is primarily generated from hospitals (AED5.10 billion), followed by medical centers (AED490.97 million) and pharmacies (AED60.58 million).
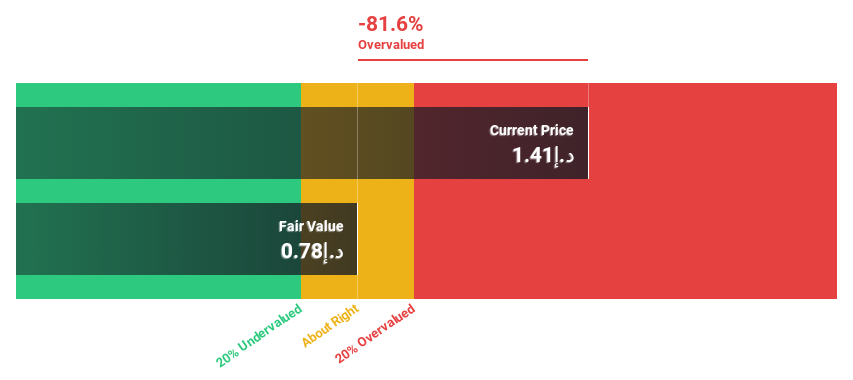
Estimated Discount To Fair Value: 41%
Burjeel Holdings is trading at AED 1.15, significantly below its estimated future cash flow value of AED 1.95, indicating potential undervaluation. Despite high debt levels and recent executive changes with a new CFO appointment, the company shows promising financial prospects with forecasted earnings growth of 15.1% annually, outpacing the AE market's 6.4%. However, its revenue growth is moderate at 8.4% per year and shares have been highly volatile recently.
- In light of our recent growth report, it seems possible that Burjeel Holdings' financial performance will exceed current levels.
- Click to explore a detailed breakdown of our findings in Burjeel Holdings' balance sheet health report.
Hanza (OM:HANZA)
Overview: Hanza AB (publ) is a company that offers contract manufacturing solutions across various regions including Sweden, Finland, and North America, with a market cap of SEK9.37 billion.
Operations: The company's revenue is derived primarily from Main Markets, contributing SEK5.32 billion, and Other Markets, adding SEK3.13 billion, with a minor contribution of SEK11 million from Business Development and Services.
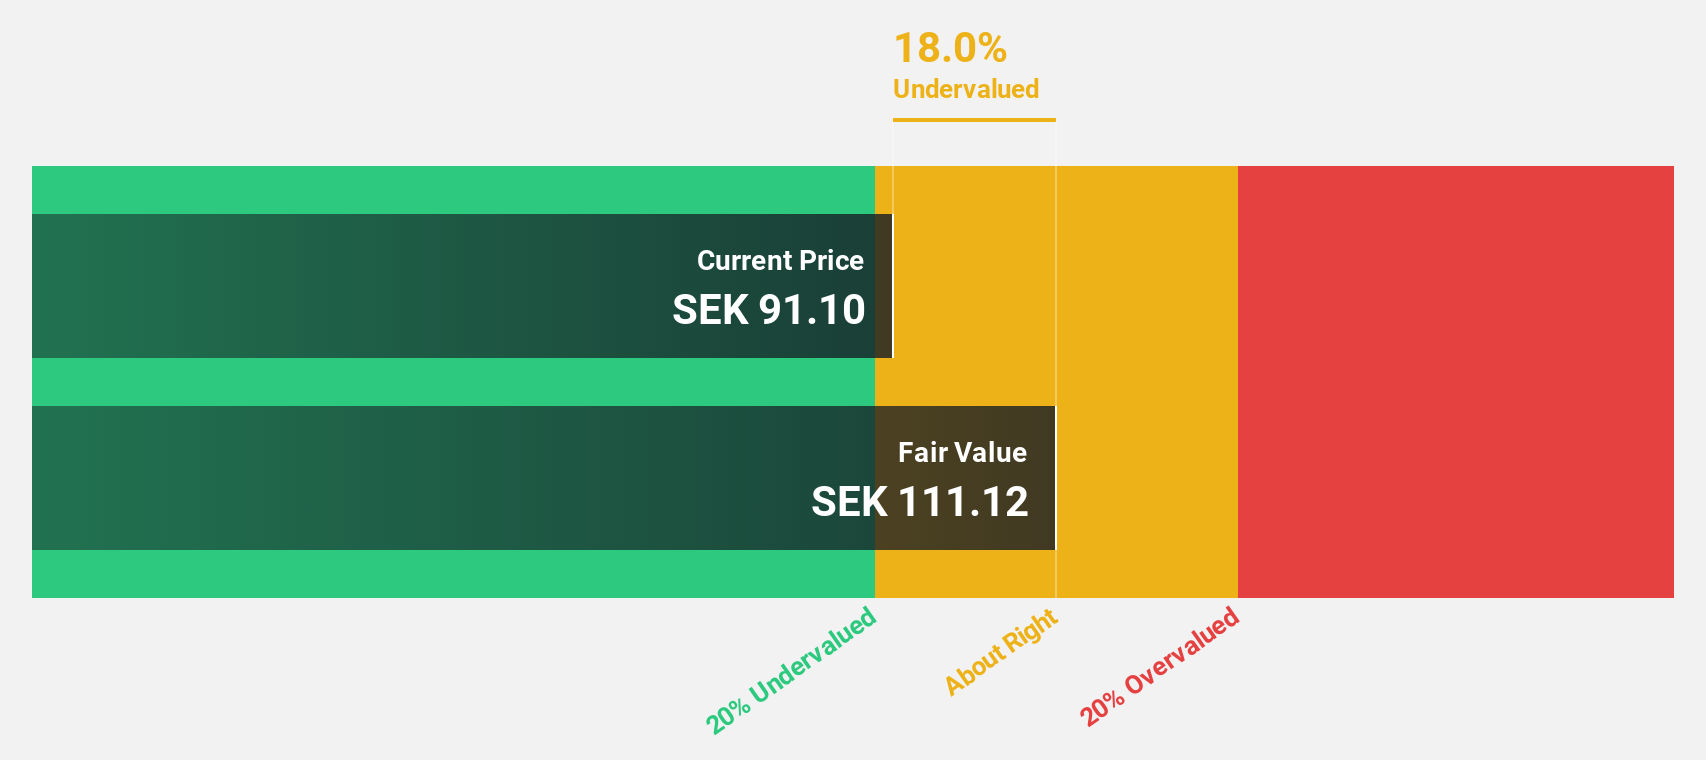
Estimated Discount To Fair Value: 48.1%
Hanza AB is trading at SEK 149, significantly below its estimated future cash flow value of SEK 287.32, highlighting potential undervaluation. Despite recent shareholder dilution and a low forecasted return on equity of 14.5%, the company exhibits robust financial prospects with expected annual earnings growth of over 32%, surpassing the Swedish market's average. Recent strategic initiatives, including share buybacks and restructuring under the Horizon program, aim to optimize operations and enhance capital structure.
- Our growth report here indicates Hanza may be poised for an improving outlook.
- Click here to discover the nuances of Hanza with our detailed financial health report.
Friedrich Vorwerk Group (XTRA:VH2)
Overview: Friedrich Vorwerk Group SE specializes in energy transformation and transportation solutions across Germany and Europe, with a market cap of €1.28 billion.
Operations: The company's revenue segments include €378.11 million from electricity, €207.61 million from natural gas, €27.67 million from clean hydrogen, and €125.16 million from adjacent opportunities.
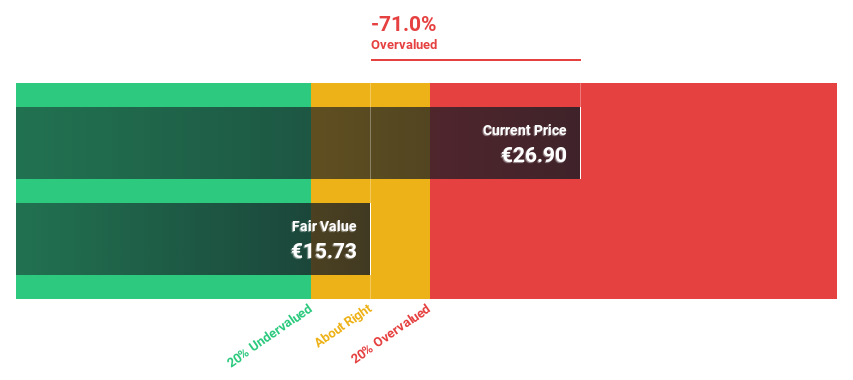
Estimated Discount To Fair Value: 30.4%
Friedrich Vorwerk Group SE is trading at €63.95, which is 30.4% below its estimated future cash flow value of €91.82, suggesting it may be undervalued based on cash flows. The company reported strong earnings growth with net income rising to €33.82 million in Q2 2026 from €19.69 million a year ago and secured a major hydrogen pipeline contract valued in the double-digit millions of euros, supporting its revenue forecast to grow faster than the German market at 10.1% annually.
- Our expertly prepared growth report on Friedrich Vorwerk Group implies its future financial outlook may be stronger than recent results.
- Delve into the full analysis health report here for a deeper understanding of Friedrich Vorwerk Group.
Taking Advantage
- Gain an insight into the universe of 109 Undervalued Global Stocks Based On Cash Flows by clicking here.
- Already own these companies? Link your portfolio to Simply Wall St and get alerts on any new warning signs to your stocks.
- Take control of your financial future using Simply Wall St, offering free, in-depth knowledge of international markets to every investor.
Searching for a Fresh Perspective?
- Explore high-performing small cap companies that haven't yet garnered significant analyst attention.
- Diversify your portfolio with solid dividend payers offering reliable income streams to weather potential market turbulence.
- Fuel your portfolio with companies showing strong growth potential, backed by optimistic outlooks both from analysts and management.
This article by Simply Wall St is general in nature. We provide commentary based on historical data and analyst forecasts only using an unbiased methodology and our articles are not intended to be financial advice. It does not constitute a recommendation to buy or sell any stock, and does not take account of your objectives, or your financial situation. We aim to bring you long-term focused analysis driven by fundamental data. Note that our analysis may not factor in the latest price-sensitive company announcements or qualitative material. Simply Wall St has no position in any stocks mentioned.
Have feedback on this article? Concerned about the content? Get in touch with us directly. Alternatively, email editorial-team@simplywallst.com