
CICC: How to balance buying AI for fear of crowding and not being able to pay for the fourth quarter?
The Zhitong Finance App learned that since this year, CICC has released a research report saying that since this year, the core conflict in the market is the ultimate differentiation between AI or not. Buying AI has a winning rate, but it has to withstand high crowding and high fluctuations; buying consumers is buying odds, but the fundamentals have been slow to be realized. As of September 26, the top five industries with overall scores under its winning odds framework were energy, insurance, transportation, pharmaceuticals, raw materials, and semiconductors ranked sixth. Looking ahead, the main events worth watching in the fourth quarter are: first, technological progress, especially Anthropic's potential listing plan and its three-quarter report; second, changes in oil prices and the Federal Reserve's interest rate discussions in October and November; third, fiscal policy, especially the Central Economic Work Conference at the end of the year; and fourth, geopolitical factors such as the US midterm elections.
CICC's main views are as follows:
Since this year, the core conflict in the market is the ultimate differentiation between AI and not. Buying AI has a winning rate, but it has to withstand high crowding and high fluctuations; buying consumers is buying odds, but the fundamentals have been slow to be realized.
The turmoil since late June shows that the winning rate alone is not working; the retracement of crowded transactions is enough to eat up the trend's profits; the consumer and real estate chains are still plummeting after being cheaper for two or three years, which means that looking at the odds alone is not working either. The configuration must answer both win and odds questions at the same time.
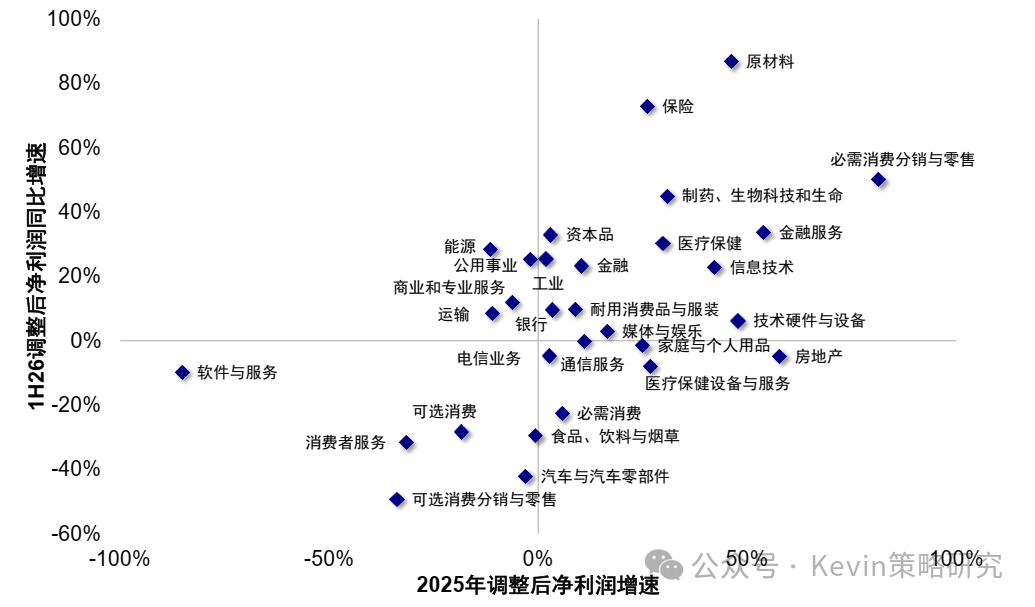
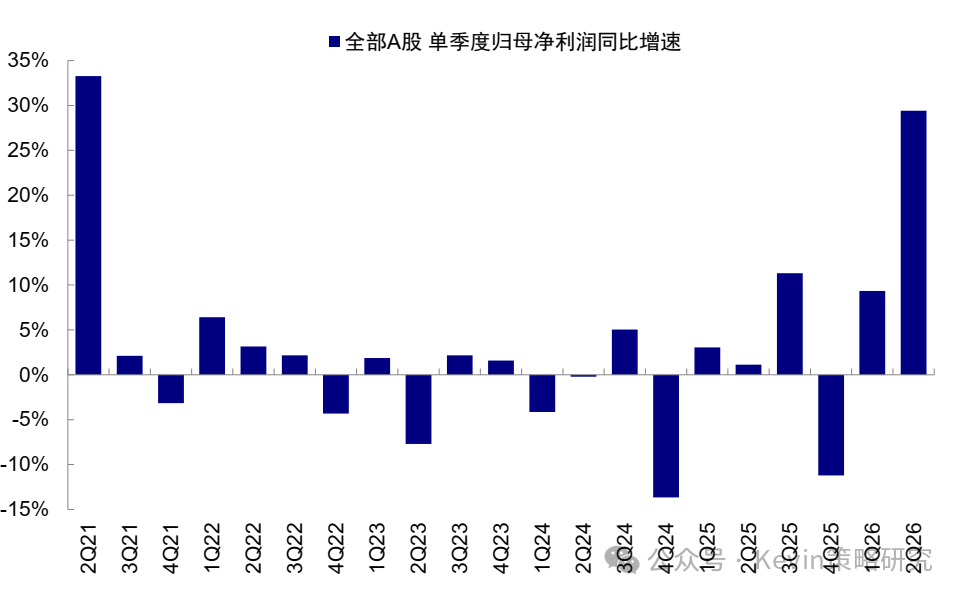
The interim report provided an updated sample for testing the above issues. Overall A's profit increased 29.4% year-on-year in the second quarter, the highest single-quarter growth rate since the third quarter of 2021. However, profits of about 40% of industries still declined year on year, and high growth was concentrated in a few industries. Similarly, the Hong Kong stock interim report showed the same differentiation. In the first half of the year, Hong Kong stock profits increased 18.2% year on year, profits from semiconductors, raw materials, and insurance had the highest growth rate, and the consumer industry generally declined (Chart 1).
Chart 1: The Hong Kong stock interim report showed a divergence similar to A-shares. Hong Kong stock profits increased 18.2% year-on-year in the first half of the year. The profit growth rate for semiconductors, raw materials, and insurance was the highest, and the consumer industry generally declined
Source: Wind, FactSet, CICC Research Division
Since the third quarter, the pattern of strong technology and weak consumption has continued; after the implementation of the Federal Reserve's interest rate hike in September, market expectations that interest rates will continue to rise in October are still fermenting, and peripheral disturbances have been repeated.
Standing at the end of September, this article answers three questions: How to construct an industry comparison framework that takes into account winning odds and odds? What are the odds and odds clues provided by the mid-report? How should the fourth quarter be configured?
1. How to balance winning odds and odds? Building a cross-industry comparison framework
In the face of extremely volatile and congested markets, there are flaws in simply setting up groups or betting high and low. In response to this pain point, we ranked the industry with comprehensive odds and wins to find better allocation strategies. We use the MSCI China Industry Index to construct a winning odds framework: 1) the win rate depicts fundamental certainty, that is, the probability that the industry will rise for some time to come; 2) the degree of asymmetry in the upward and downward space in which the average value of the valuation returns.
The win rate consists of two parts: micro liquidity and profit expectations. First, micro liquidity portrays the strength and weakness of the industry's own transactions, including momentum, volatility, and volume-price elasticity. Second, the profit expectation factor horizontally compared the dynamic EPS and ROE changes in various industries over the same period last year, but considering that the seller's consistent expectations often lag behind, we adjusted profit expectations by further supplementing contract debts+advance accounts receivable on the basis of the original framework. Changes in the year-on-year growth rate of contract liabilities and advance accounts receivable (second-order guidance) can reflect the direction of changes in demand to a certain extent. This data is mainly taken from A-share earnings reports. Although there are errors with some industries dominated by Hong Kong stocks, it can better reflect the full picture of most industry data.
Odds, on the other hand, are obtained based on the combined quantiles of PE, PB, and PS in various industries. The cheaper the valuation, the higher the odds score. This is based on the return characteristics of the average value of the valuation. Cheapness itself is an important source of space.
The reason for combining the two dimensions of win rate and odds is because there are obvious limitations to using any of these dimensions alone:
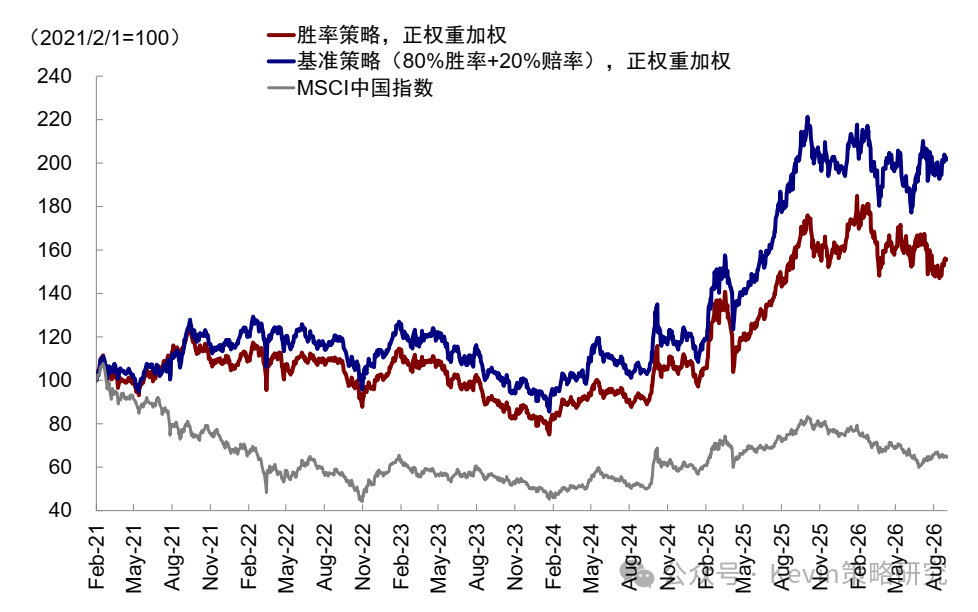
If you only look at the win rate, it is easy to experience a major pullback in crowded transactions. If we only filter the industry by win rate, our backtesting shows that under the strategy of positive weight (higher scores give higher positions), the annualized return of 8.1% and maximum drawdown of -40.4% from February 2021 to August 2026 showed clearly worse performance than the results of combining win rate and odds (Chart 2). The win rate is essentially a confirmation of an existing trend. If the trend continues, you can hold positions or continue to reap excess profits; however, once the narrative or macro paradigm shifts, the variety with the most extreme increase in the early period falls the most when disturbances occur, or the “winner's curse.” This is the case with semiconductors this year. The consensus expectation and capital group drove the sector's rapid upward trend in the first half of the year, yet it has retreated sharply from a high point since late June due to disturbances due to multiple factors.
Chart 2: Looking only at win rates, it is easy to experience major pullbacks in crowded transactions, which is not conducive to long-term performance
Note: The backtest data is from February 2021 to August 2026, and later the same
Source: Wind, FactSet, CICC Research Division
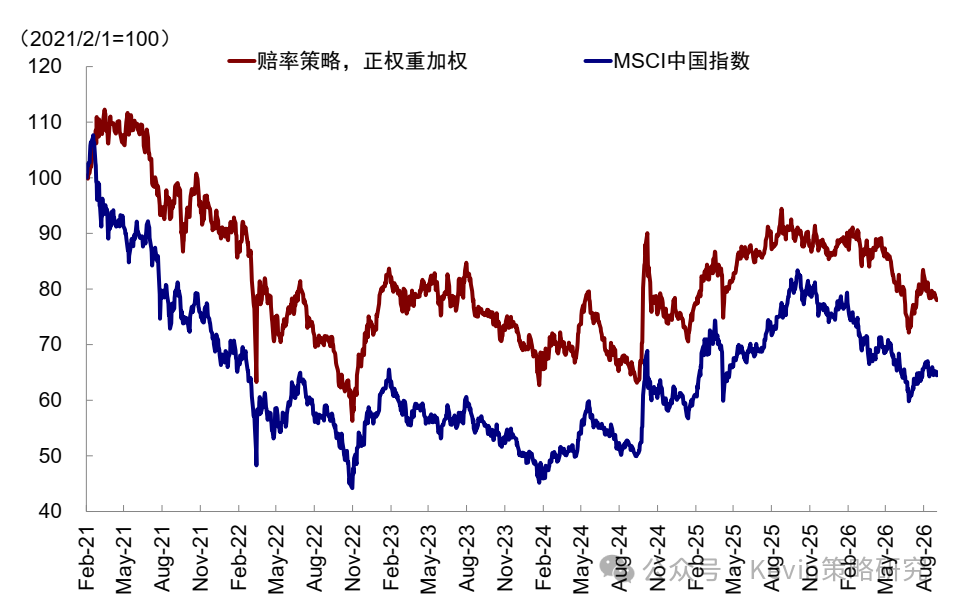
If you just look at the odds, the opportunity cost is too high, and you may fall into an “undervaluation trap.” If only the odds were used, the annualized return was -4.3% since 2021, and losses for three consecutive years from 2021 to 2023 (Chart 4). Most of the cheap assets in the market are cheap. Undervaluations often correspond to lack of fundamentals. The continuous downturn in the consumer and real estate chains over the past two years is an example. The essence of game odds is a game reversal, but if the “catalyst” that causes the reversal never appears, then odds assets often continue to contribute negative returns. For investors in particular, the problem with just looking at odds is the “opportunity cost” of a long-term downturn.
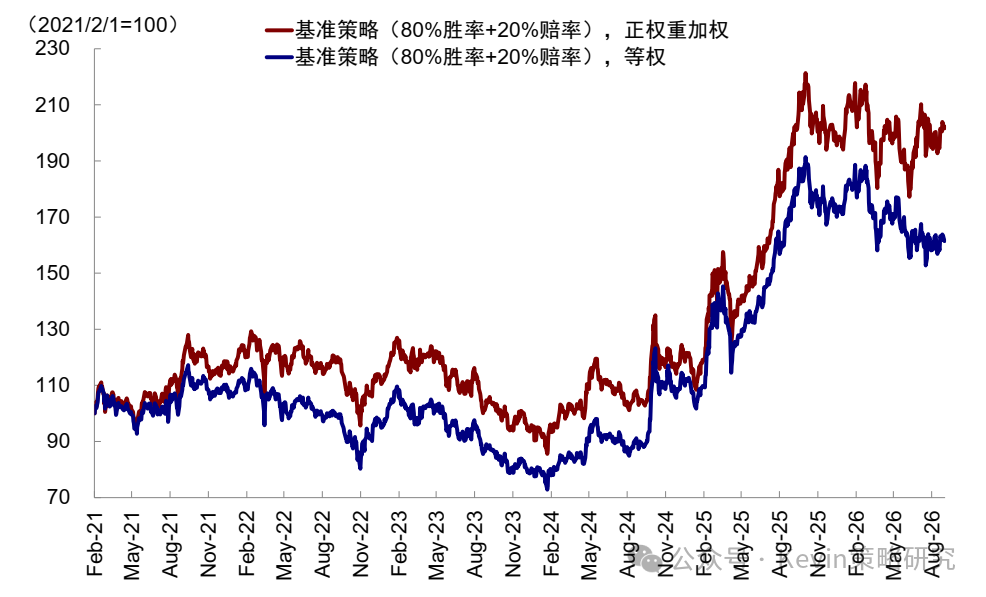
Chart 3: Under the benchmark strategy, net worth performance with a decreasing overall score configuration (positive weight) is superior to an equal weight allocation
Source: Wind, FactSet, CICC Research Division
Chart 4: If you only look at odds, you may fall into an “undervaluation trap”
Source: Wind, FactSet, CICC Research Division
In contrast, a screening strategy that focuses on win rate and takes into account odds can have better results. In practice, we obtain a comprehensive score for each industry based on 80% win rate and 20% odds score, select the top five industry combinations, and adjust positions on a monthly basis based on the score level. Backtesting shows that from February 2021 to August 2026, this strategy was effective in defeating the benchmark index. From February 2021 to August 2026, the strategy combination was 13.2% annualized and 33.8%, which was significantly superior to MSCI China (annualized -7.5%, retracement -59.0%); furthermore, according to the strategy of empowerment based on high and low scoring, the return was higher than the equivalent strategy (about 8.8% annualized), which also confirmed the effectiveness of our scoring.
2. Clues to the win rate in financial reports: who is cashing out and who is left behind?
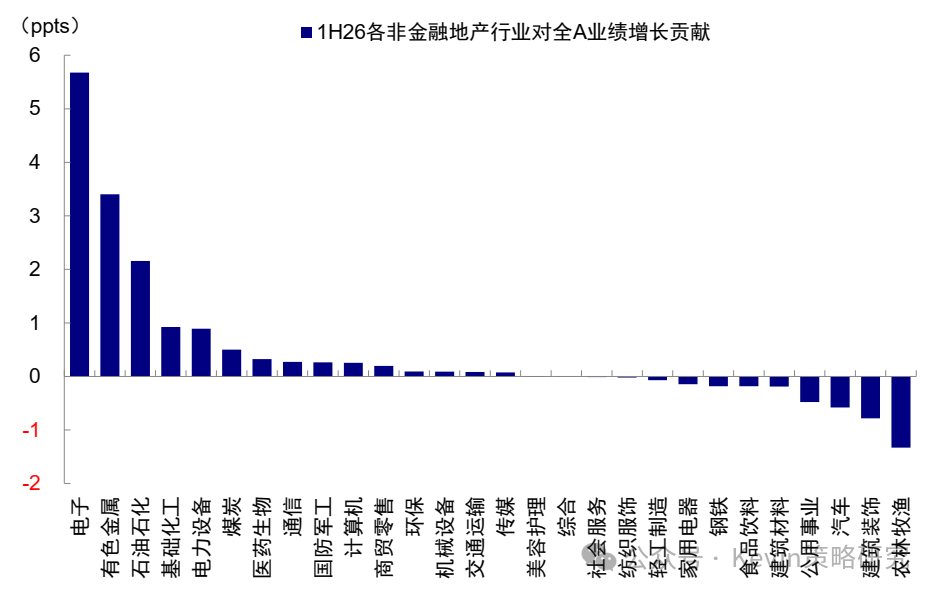
Overall, A-share earnings growth in the second quarter was impressive, but high growth was concentrated in a few industries, and structural differentiation was still extreme. Overall A and non-financial profits increased by 29.4% and 25.2% year-on-year respectively in the second quarter, the highest growth rate since the third quarter of 2021 (Chart 5), but profits in about 40% of the industry still declined year-on-year. Looking at the cumulative scale of the previous six months, total A and non-financial profits increased by 19.4% and 20.6% respectively. The increase in non-financial profits was mainly contributed by the four industries of electronics, non-ferrous metals, petroleum and petrochemicals, and basic chemicals, while the remaining non-financial industries combined declined net (Chart 6). Furthermore, the appreciation of the RMB amplified exchange losses, accounting for 5.8% of total non-financial net profit due to mother, the highest since 2015, with overseas chains such as household appliances, machinery, electrical equipment, and automobiles bearing the brunt. The interim report of Hong Kong stocks is similar to that of A-shares. The overall profit of Hong Kong stocks increased by 18.2% in the first half of the year. Semiconductors (335%), raw materials (87%), and insurance (73%) also had the highest growth rates. Consumer industries such as automobiles, food and beverage generally declined by 20% to 50% (Chart 1).
Chart 5: Net profit from 2Q26 to mother was the highest quarterly year-on-year since 3Q21
Source: Wind, FactSet, CICC Research Division
Chart 6: On a cumulative basis, the increase in non-financial profits was mainly contributed by the four industries of electronics, nonferrous metals, petroleum and petrochemical, and chemical
Source: Wind, FactSet, CICC Research Division
From a win rate perspective, who is cashing out and who is left behind? What is being realized is pan-external demand and AI hardware; what is left behind is pan-consumption and the Internet. This is consistent with the current win rate ranking given by our framework. As of September 26, the top five industries in the overall score were energy, insurance, transportation, pharmaceuticals, and raw materials. Most of the above directions were pan-external demand varieties, and semiconductors ranked sixth (Chart 30).
First, most of the industries with the highest performance growth rate are in the direction of high win rate selected by the framework. Shenwan's tier-1 industry (electronics, non-banking, non-ferrous, coal, basic chemicals, petroleum and petrochemicals), which had the top six profit growth rates in a single quarter in the second quarter, corresponded to semiconductors, which scored sixth in the framework, and insurance, raw materials, and energy in the top five. Furthermore, the profits of transportation selected in the framework (the weight is shipping, shipping port profits increased 32.6% year over year) and the innovative drug chain (biological products increased by 141%, chemical pharmaceuticals increased by 14.8%) are being realized. The opposite direction was also established. Consumer sectors such as automobiles, food and beverage, social services, and home appliances, which have poor performance, are all low win rate and high odds directions selected by the framework.
Second, most of the industries with the highest ROE improvements were also captured by the framework. Among Shenwan's second-tier industries, the second-quarter ROE (TTM caliber, same below) improved year-on-year. The top ten differences were energy metals, semiconductors, industrial metals, games, insurance, other electronics, communication equipment, batteries, small metals, and components. Among them, with the exception of batteries and games, the remaining eight are all in the direction of raw materials, insurance, and AI hardware captured by the framework; with the exception of breeding and feed, where the pig cycle is declining, it is concentrated in consumer industries such as retail, kitchen and bathroom appliances, liquor, white goods, etc., and also falls in the direction of low win rate selected by the framework.
In addition to post-test profit and ROE, some forward-looking orders and inventories also indicate that differentiation continues. This can be mutually verified with the high-frequency data situation:
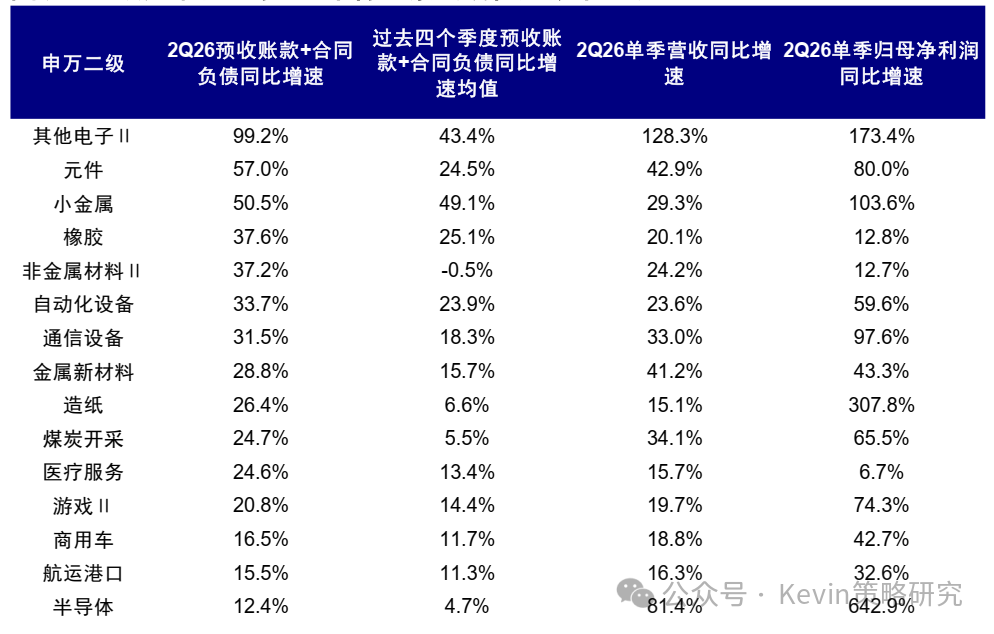
Orders show that the division between strong technology and weak consumption continues. Using advance receipt+contract debt as a proxy indicator for orders, the year-on-year growth rate of electronic orders accelerated to 21.4%, with communication equipment and semiconductors increasing by 31.5% and 12.4% respectively; consumer sector orders only increased by 0.1% and remained flat, while food, beverage, trade and retail sales declined by 4.6% and 4.0% respectively. Looking further, the industries where the boom is still accelerating are concentrated in a few directions. Of the 124 Shenwan secondary industries, only 15 met the four conditions of order growth of more than 10%, improvement over the average of the past four quarters, revenue exceeding 10% year-on-year, and net profit to mother being positive year-on-year in a single quarter (Chart 8). In addition to AI hardware (other electronics, components, communication equipment, semiconductors), resource products (small metals, non-metallic materials, new metal materials, coal mining, rubber), manufacturing and export chains (automation equipment, commercial vehicles, shipping ports, paper) are also listed, which is basically in line with the high win rate direction of energy, raw materials, and transportation screened out by the frame.
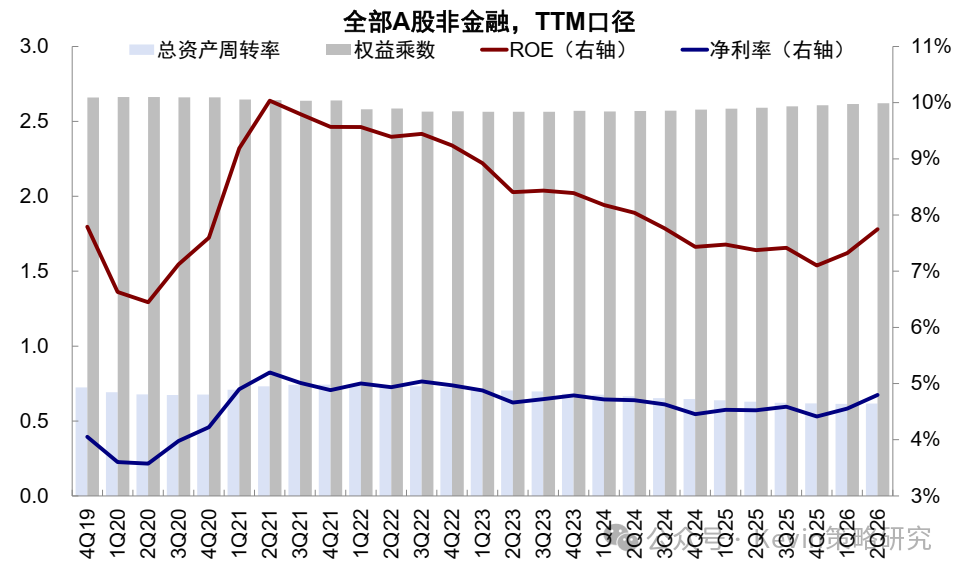
Chart 7: Looking at DuPont's dismantling, the full A non-financial ROE (TTM) recovery was mainly driven by profit margins
Source: Wind, FactSet, CICC Research Division
Chart 8: Leading indicators show that the boom in 15 industries is likely to continue
Note: The industry classification uses Shenwan's second-level industry
Source: Wind, FactSet, CICC Research Division
The order, combined with inventory, can better show the status it is in. In terms of technology, stocks of semiconductors and communication equipment increased by 40.4% and 40.6%, respectively. Orders and revenue increased at the same time, which was active replenishment due to strong demand; in the consumer sector, food and beverage orders fell 4.6%, but inventory increased by 9.5%, which was a passive reserve due to insufficient demand; commercial retail orders and inventory fell by 4.0% and 3.3%, respectively, and were actively removed from storage.
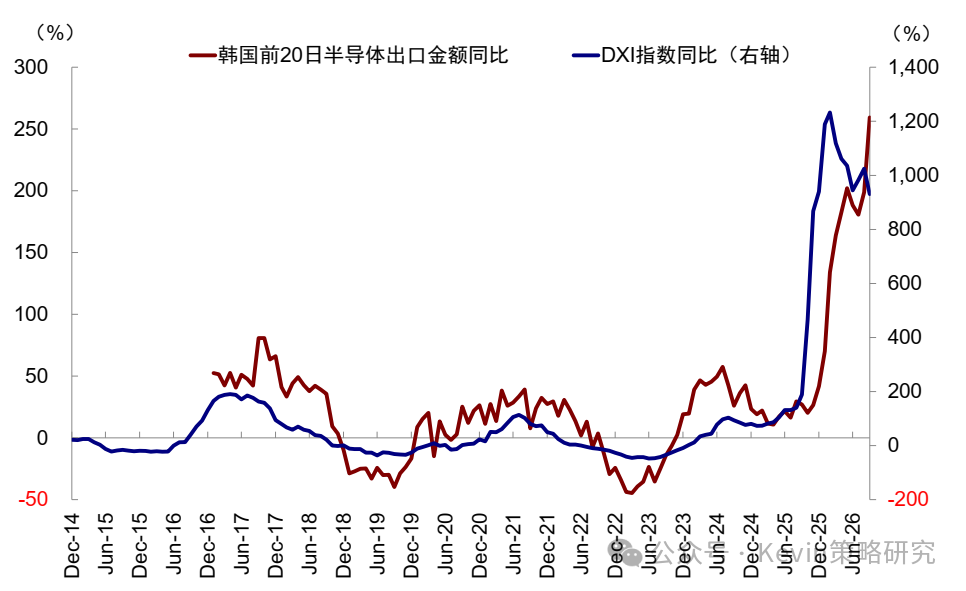
High-frequency data since September shows that the economic structure continues to diverge. The computing power chain boom continued. South Korea's total exports increased 78.3% year on year to US$71.4 billion in the first 20 days of September, the highest in the same period since a record; among them, semiconductor exports increased 259% year on year, further up from 199% in August (Chart 9). Storage prices rose at the same time. The DXI index rose 931% year on year in September. Although it fell slightly from 1025% in August, it is still at an all-time high, and the storage price increase cycle continues. Traditional domestic demand has not reached an inflection point. The newly announced August Social Security Zero increased by only 0.4% year on year, with automobile retail sales falling 18.5% year on year [1]; China Automobile Dealers Association retailed 888,000 passenger cars nationwide before September 20, down 22% year on year [2], and terminal demand is still weak.
Chart 9: High-frequency data shows that the computing power chain boom continues
Source: Wind, FactSet, CICC Research Division
3. Odds clues in financial reports: Consumption is cheap, but is just cheap enough?
The direction with the highest odds right now is almost all about spending. In the latest results of the winning odds framework, industries such as food and beverage, durable goods, automobiles, consumer services, e-commerce retail and other industries are all at a 5-year low valuation, and the odds are among the highest.
The reason for cheap consumption is that demand is weak and still weakening. At the interim report level, most profits in the A-share consumer industry declined, and sector ROE (ROE and profit margin are TTM caliber, same below) fell from 9.4% in 2Q25 to 7.1% for four consecutive quarters. Consumption is a margin-driven industry. The decline in ROE is almost entirely due to profit margin compression, and the sector's gross margin fell from 26.4% to 25.6% during the same period. Major consumer sectors of Hong Kong stocks also weakened across the board. Profits from optional consumption and essential consumption declined by 28.2% and 22.6% respectively in the first half of the year. View by category:
Necessary consumption has declined markedly. Food and beverage profits fell 18.9% year on year, with liquor falling 21.4%; gross margin of food and beverage fell from 50.9% to 48.9%, ROE from 19.0% to 15.8%, and liquor ROE from 24.6% to 19.3%. The divergence between inventory and revenue also shows that it is constrained by the demand side: food and beverage inventory increased by 9.5% while revenue fell 4.8%, liquor inventory increased by 12.4%, and revenue fell 17.0%, which was passive accumulation rather than active expansion.
Consumption of bulky goods is also weakening. After the trade-in policy declined, automobile profits fell 19.3% year on year. Among them, passenger car revenue turned negative year on year (-2.7%), profit fell 64.4% year on year, and ROE fell from 7.5% to 3.9%; home appliance profit fell 4.8%, white goods ROE fell from 19.8% to 15.7%; household goods profit fell 50.0%, and ROE fell from 8.2% to 4.3%.
The same was true for the Hong Kong stock consumer sector. Profits from food and beverage, automobiles, consumer services, optional consumer distribution and retail (mainly e-commerce retail) declined by 29.5%, 42.0%, 31.5%, and 49.3% respectively in the first half of the year.
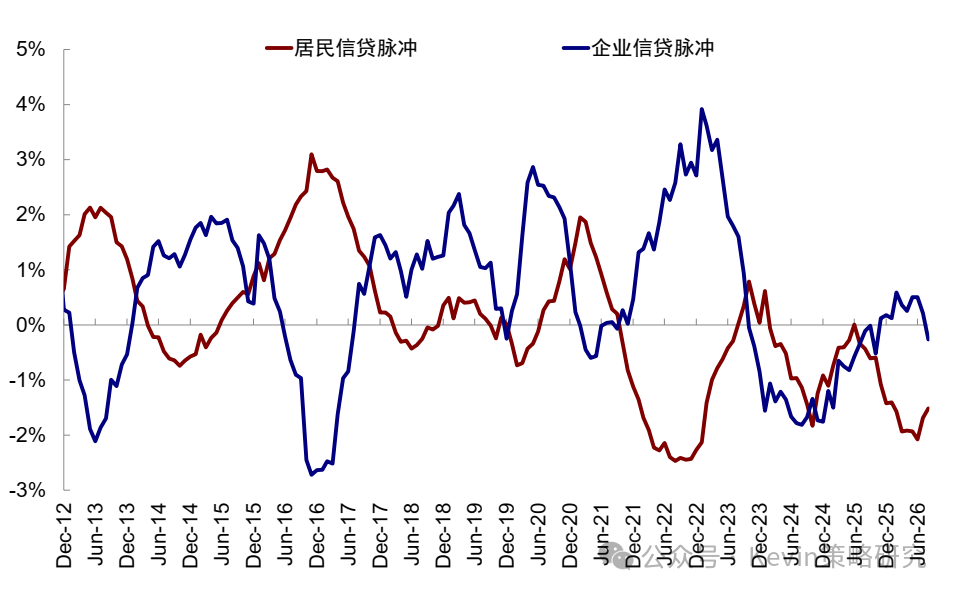
Economic data also shows that the weakening of the consumer and real estate chains continues. In August, Social Security Zero increased 0.4% year on year, falling further 0.2 percentage points from July. Retail sales of consumer goods above the limit fell 3.7% year on year in August. The root cause of weak demand lies in the residential sector. Employment and real estate are the core restrictions on credit expansion in the residential sector: 1) Weak employment and income expectations. The unemployment rate in the August urban survey rebounded to 5.3%. In August, the manufacturing PMI employee segment fell 0.3 percentage points to 48.7%, and the employment situation is still shrinking; 2) Real estate has not yet stabilized. The sales area of newly built commercial housing fell 12.1% year on year in January-August, and the decline was once again 0.5 percentage points higher than in the first half of the year. As a result, residents' credit pulse is still in a low range, and there is no motivation for spontaneous recovery (Chart 10).
Chart 10: Residents' credit pulse is still low
Source: Wind, FactSet, CICC Research Division
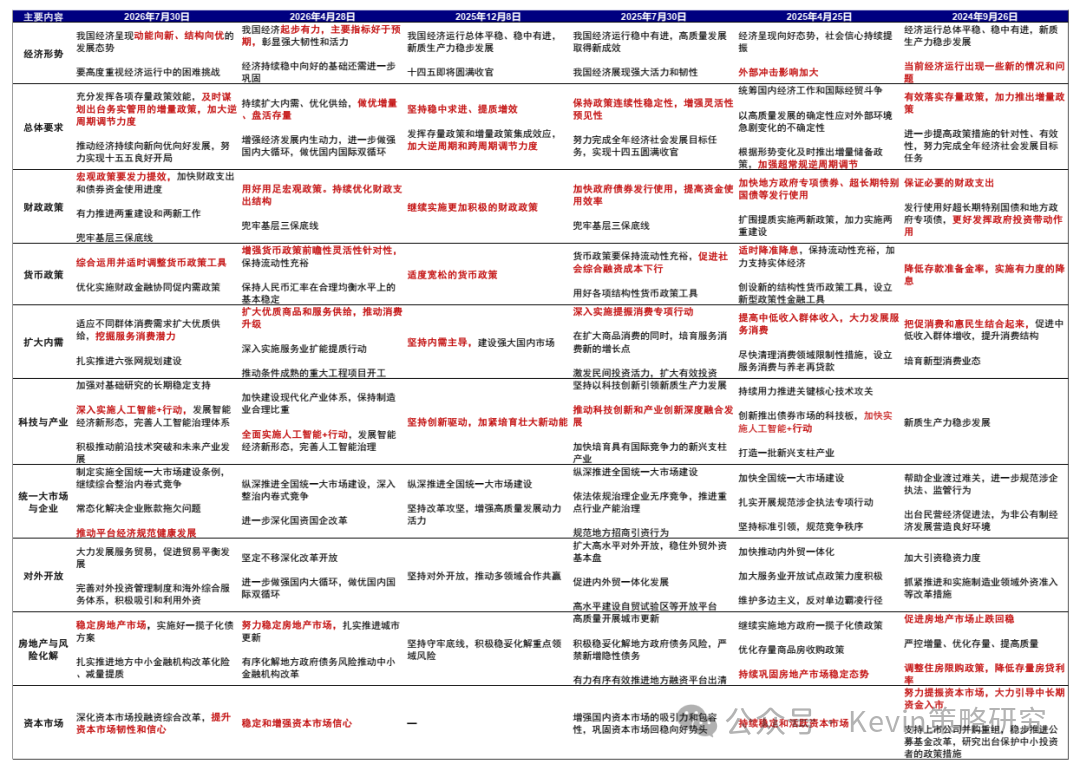
Policy signals are currently insufficient to reverse the weakness in consumption and domestic demand. In a situation where residents' credit is difficult to recover endogenously, the key to the direction of consumption and domestic demand is whether finance can be vigorous and skewed towards consumption; the policy boost signal strength of the July Politburo meeting was lower than the two meetings in September 2024 and April 2025. Even if fiscal strength began to “track progress” thereafter, its intensity was not enough to drive consumption and domestic demand out of the trend recovery (Chart 11).
Chart 11: Comparison of the six Politburo meetings
Source: Chinese Government Network, CICC Research Department
The issuance progress of local government special bonds can support the above views. Issuance was indeed accelerated after the conference. The issuance of new special bonds in August/September was about 520 billion yuan and 620 billion yuan respectively, and reached a new monthly high in September; however, progress was slow. The cumulative issuance schedule as of September was 80.6%, still lower than the 3pcts in the same period last year, the lowest for the same period since 2023 (Chart 12). In other words, the income from allocating consumption at this stage is mainly money for valuation repairs and hedging fluctuations; even if catalytic implementation is implemented, internal consumer scrutiny is needed.
Chart 12: The overall issuance progress of local government special bonds this year is relatively slow
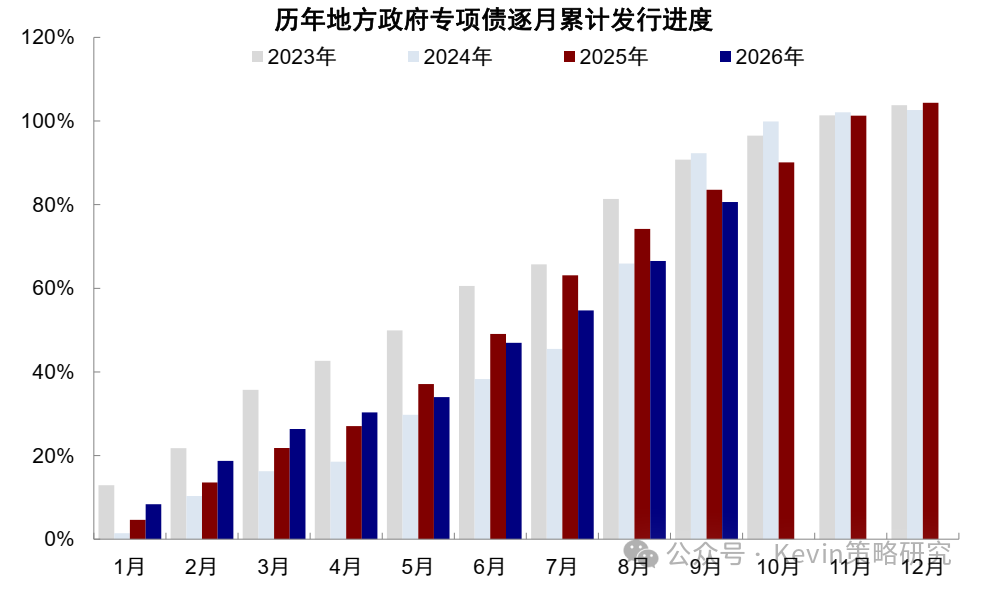
Note: Based on the cumulative total issuance amount compared with the number of plans at the beginning of the year, the plan data for 2023 [3], 2024 [4], 2025 [5], and 2026 [6] are from previous government work reports
Source: Chinese Government Network, Wind, CICC Research Department
Fourth and fourth quarter allocation ideas: technology and other industries catalyzed, weekly expectations that interest rate hikes will be implemented, domestic demand will have to wait for policies; if they don't work, there will only be dividends
The interim report confirmed the fundamental basis of K-type differentiation. High-frequency data from the third quarter showed that differentiation continued, with strong technology and weak consumption. After the fluctuations since late June, technology is temporarily in a tangled position, and peripheral disturbances such as the Federal Reserve's interest rate hike are still repeated. Looking ahead to the fourth quarter's allocation approach, according to different driving forces, the sector can be divided into four categories: technology is waiting for industry trends; the cycle depends on the Fed's interest rate hike and domestic demand will have to wait; if that doesn't work, then it can only return to the dividend strategy, that is, it is a return to the pattern before “9/24” in 2024.
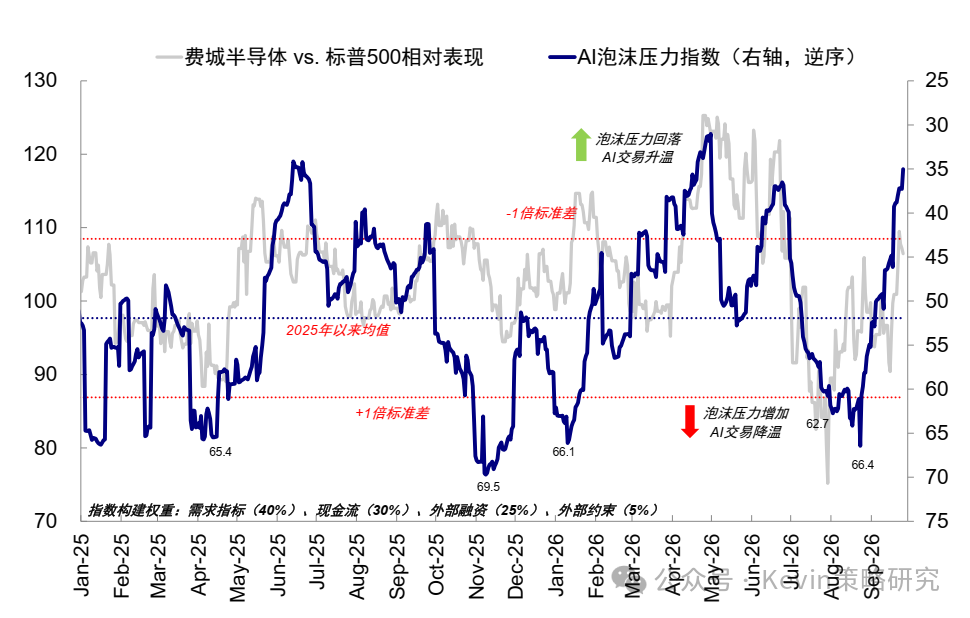
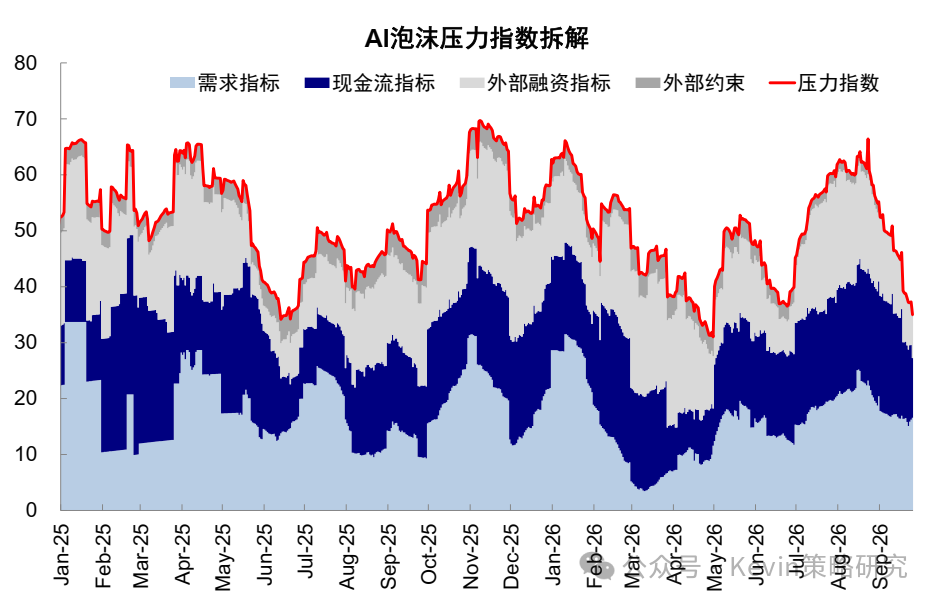
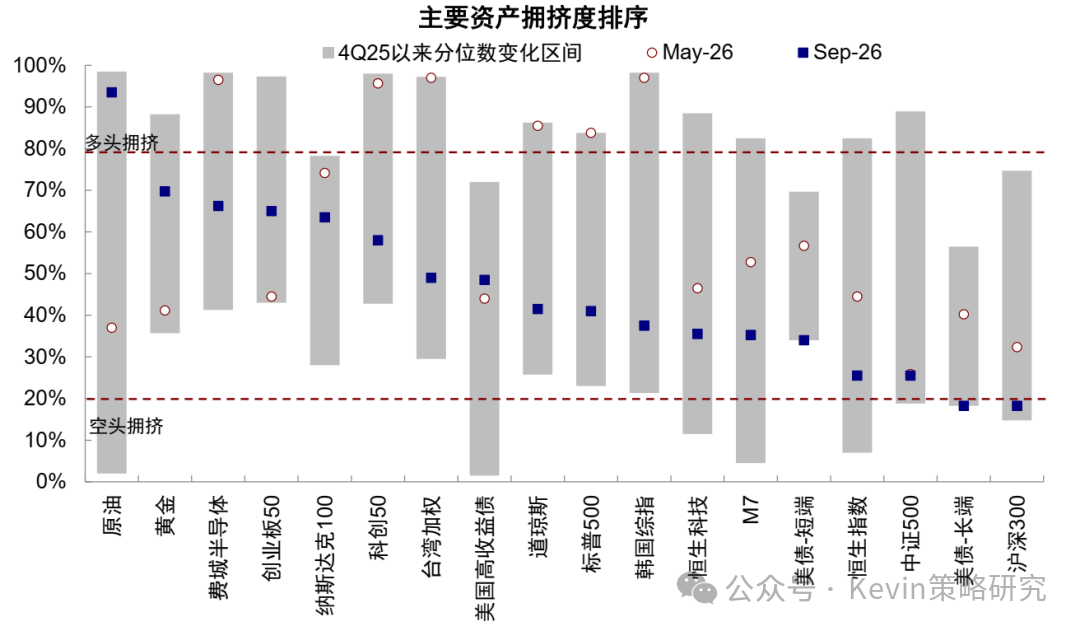
The first is technology. Downside risks are mitigated, and upward space needs to be catalyzed. This is the current “dilemma” of technology. Three factors mean that the downside risks of technology are being mitigated: first, the fundamentals are still improving. The AI bubble pressure index we are tracking continued to decline as of September 25. The two segments of cash flow (-2.99) and external financing (-1.45) were the main sources of improvement, benefiting respectively from improved free cash flow and cloud business revenue expectations and improved credit spreads on technology bonds; the demand side weakened slightly due to a slowdown in average daily token usage; the relative performance of Fee Ban, which had not rebounded significantly before, has also been repaired (Chart 13-14); second, the bubble pressure at the transaction level continues to ease ( (Chart 15); Third, the Federal Reserve raised interest rates in September. Unless there is an aggressive rate hike, the hardest phase of impacting interest rates is over.
Chart 13: AI pressure index has declined slightly recently
Source: Wind, FactSet, Bloomberg, CICC Research Division
Chart 14: By category, cash flow and external financing are the main sources of recent improvements
Source: Wind, FactSet, Bloomberg, CICC Research Division
Chart 15: Tech stock congestion has improved recently
Source: Wind, FactSet, Bloomberg, CICC Research Division
However, opening up upward space requires industrial catalysis. Without new model breakthroughs or performance implementation, it is difficult for valuations to break through previous highs. Within technology, the certainty of each aspect is not the same:
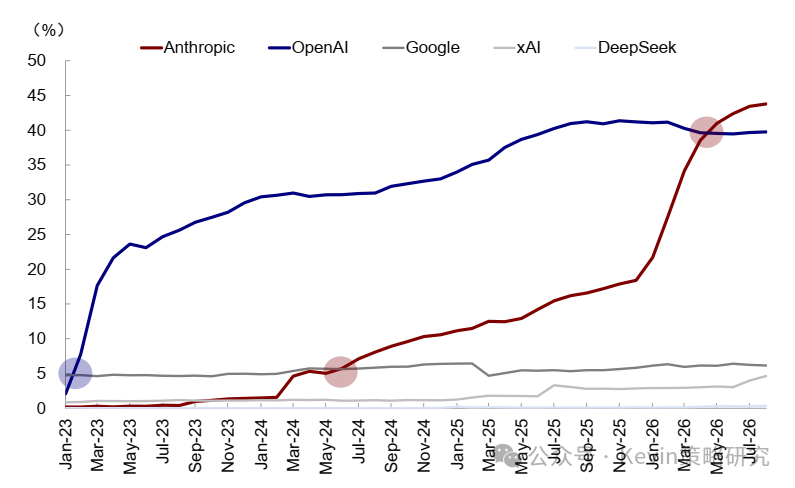
The model is the most fundamental part, but it is difficult to determine the “winner” at the company level. Without continuous iteration of cutting-edge models, there is no way to talk about application implementation, new scenarios, capital expenditure, and hardware drivers. This is also the reason why the market is worried that the slowdown in cutting-edge model iteration will slow down the overall progress of the industry; however, model investment can determine industry trends, making it difficult to select individual stocks. Gemini, which was unanimously optimistic about the market last year, is clearly left behind this year. Currently, leading model companies may not remain ahead next year, and the model process is more suitable for participating in a “basket” approach (Chart 16).
Figure 16: The model is the most fundamental part, but it is difficult to determine the “winner” at the company level
Source: RampAI [7], CICC Research Division
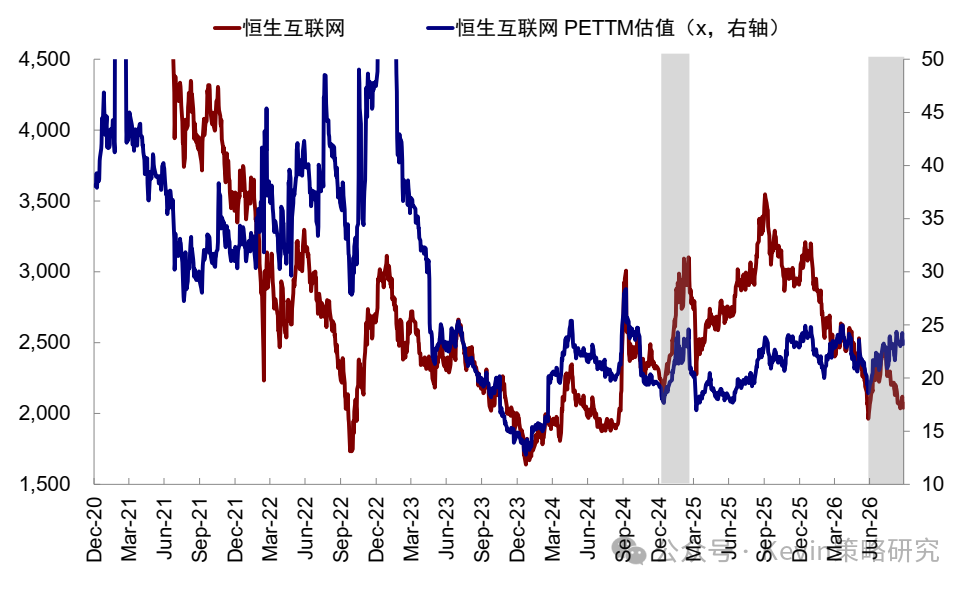
Applications are very important. The space for imagination is mainly TOC, but it is uncertain who can do it and how to trade. Meta's Muse and other developments have made the market look forward to AI agents for individual users. The revenue effect of individual payments is wider than corporate payments; however, it is currently uncertain who can do it and when. Currently, the Hong Kong stock internet is still more of a valuation repair logic, and further trading space also requires a breakthrough similar to the “DeepSeek Moment” at the application level (Chart 17).
Chart 17: Currently, the Hong Kong stock Internet is still more of a valuation repair logic; further trading space also requires industrial catalysis
Source: Wind, FactSet, Bloomberg, CICC Research Division
Short-term certainty lies in hardware, especially bottlenecks. Until the future of models and applications opens up, investment certainty is in supply-limited assets such as US computing power, Chinese chips, optical modules, and glass substrates. In terms of pace, we believe that the current hardware profit cycle may have reached the middle and lower stages. Around 2Q27 is a key window for fundamental verification.
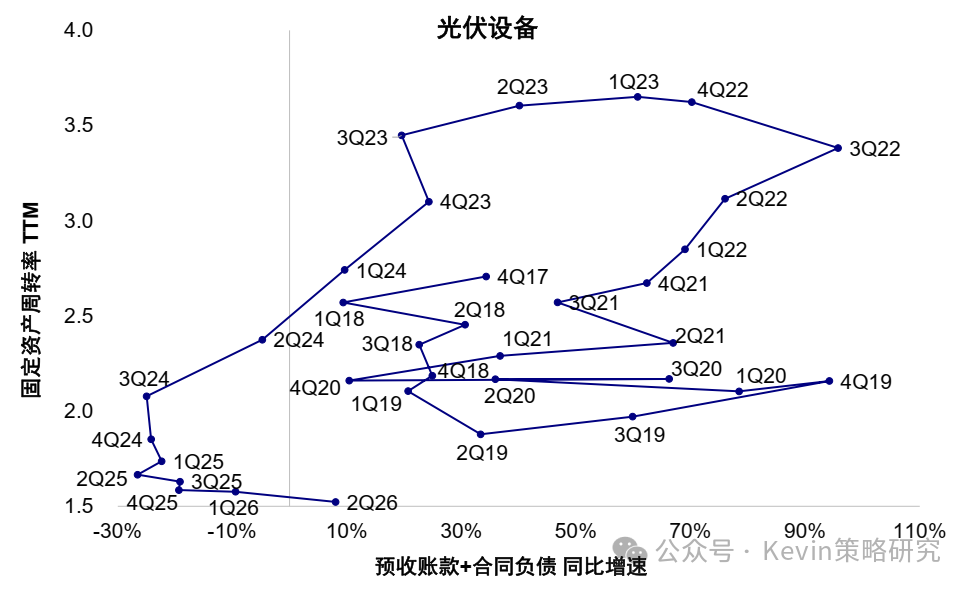
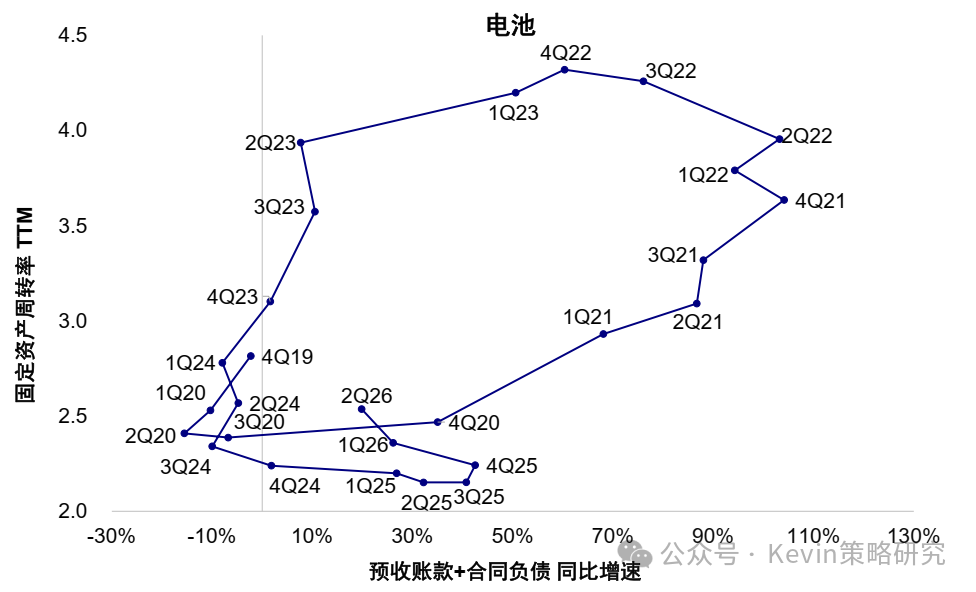
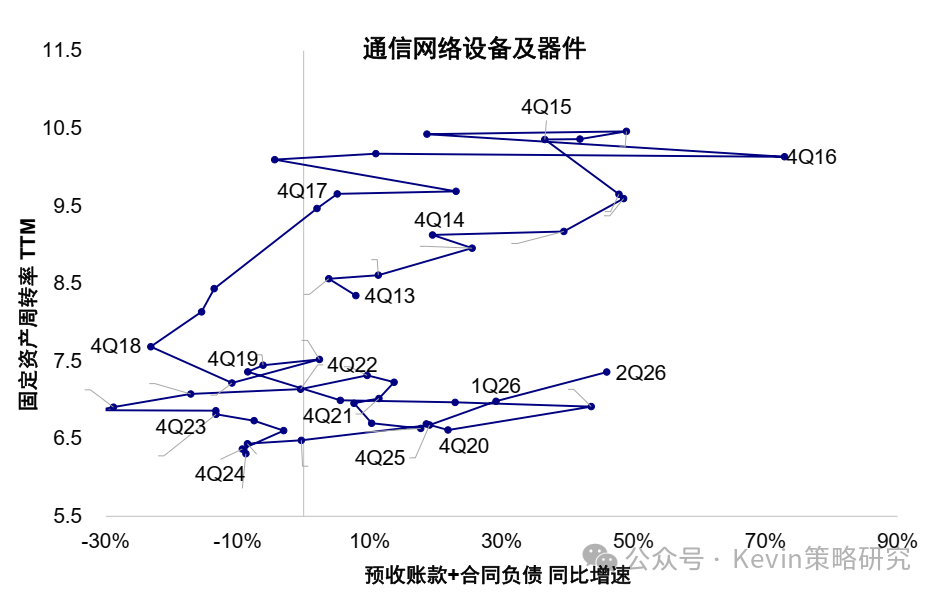
Taking optical modules as an example (the financial reporting caliber roughly corresponds to Shenwan's third-level communication network equipment and devices), demand is still growing but has not reached historical extremes. The order growth rate rose to 45.9% in the second quarter, while the top order growth rate of the PV and battery markets was close to or above 100% (chart 18-20), breaking their respective record highs; fixed asset turnover (TTM) rebounded for five consecutive quarters after bottoming out in 1Q25. Referring to the 7-10-quarter upward cycle of wind power, photovoltaics, and batteries, the top window of this round was generally from 4Q26 to 3Q27.
Chart 18: In the 2020-2022 PV market, the fixed asset turnover ratio rose 9Q, and the growth rate of advance receiving+contract debt reached a record high
Source: Wind, FactSet, CICC Research Division
Chart 19: In the 2020-2022 tram market, the fixed asset turnover ratio rose 9Q, and the growth rate of advance receiving+contract debt reached a record high
Source: Wind, FactSet, CICC Research Division
Chart 20: Currently, the fixed asset turnover rate of communication network equipment and devices has risen by 5Q, and the growth rate of advance receipts+contract liabilities has not reached a new high
Source: Wind, FactSet, CICC Research Division
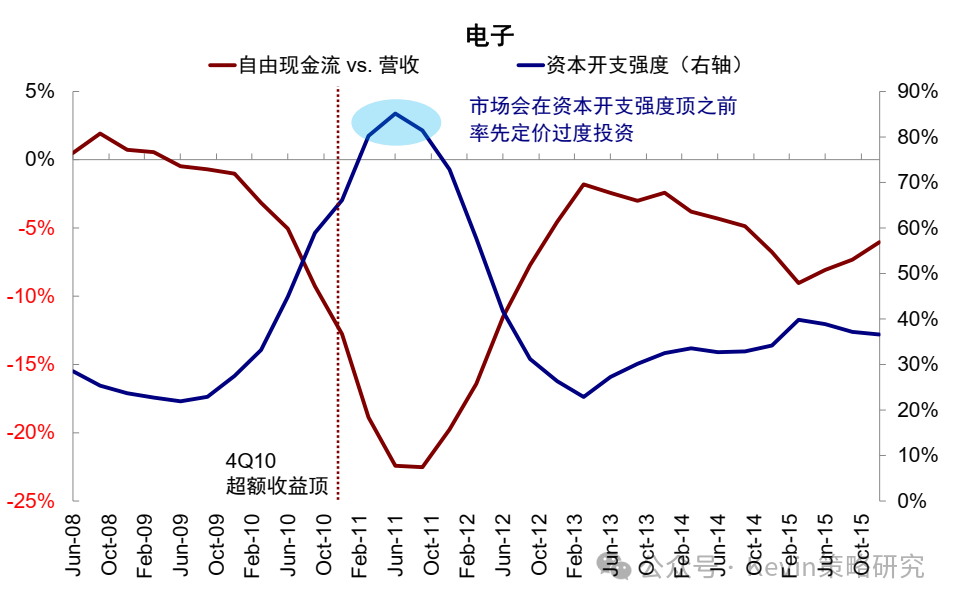
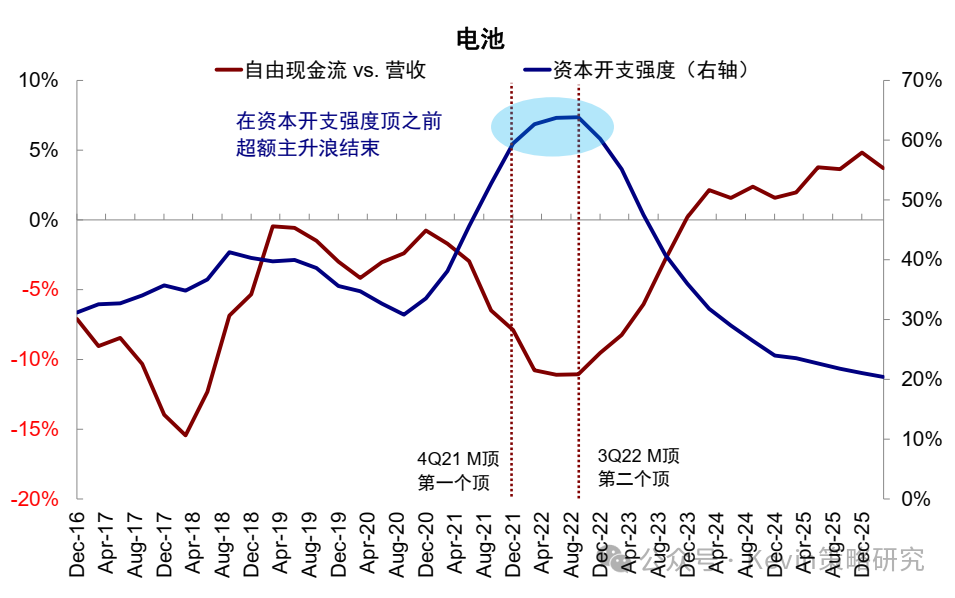
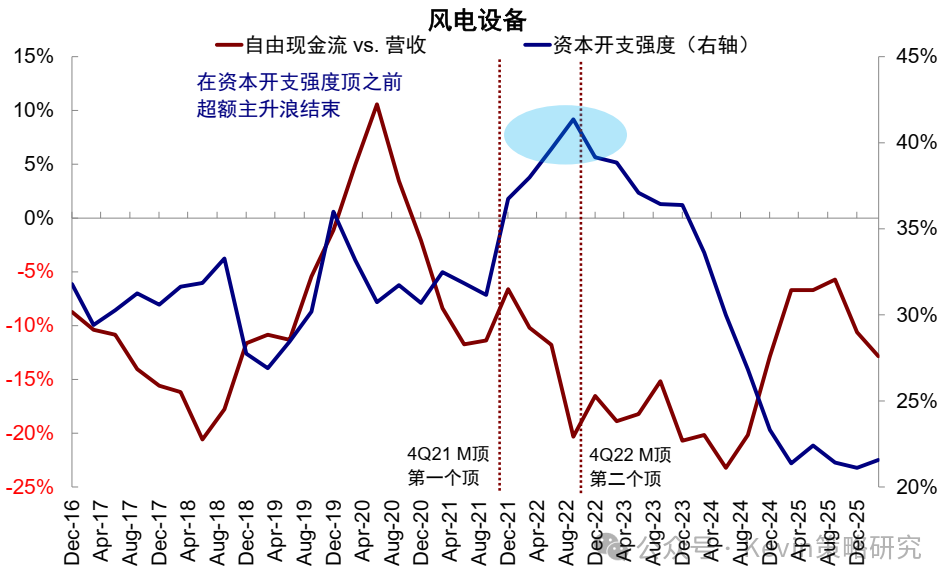
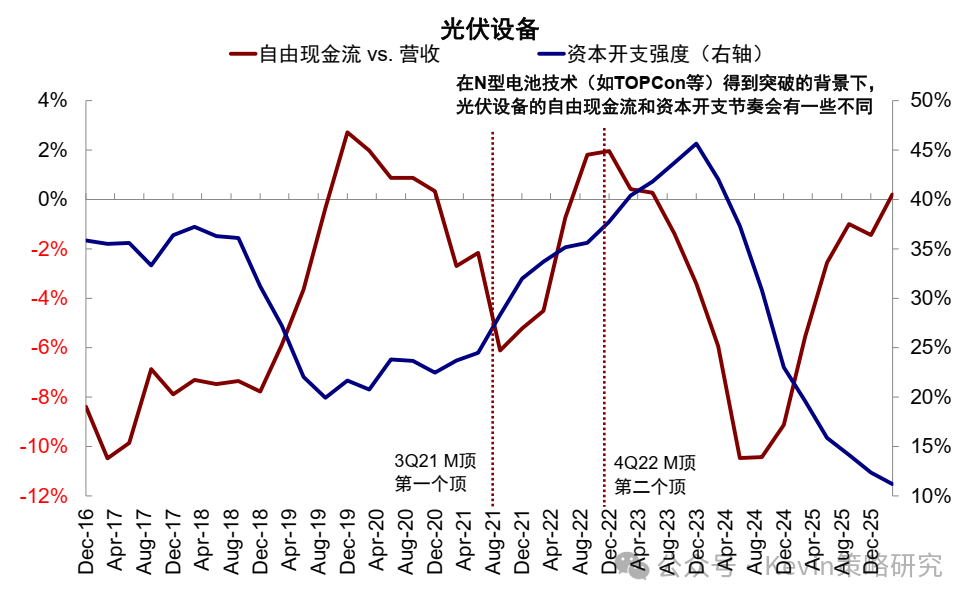
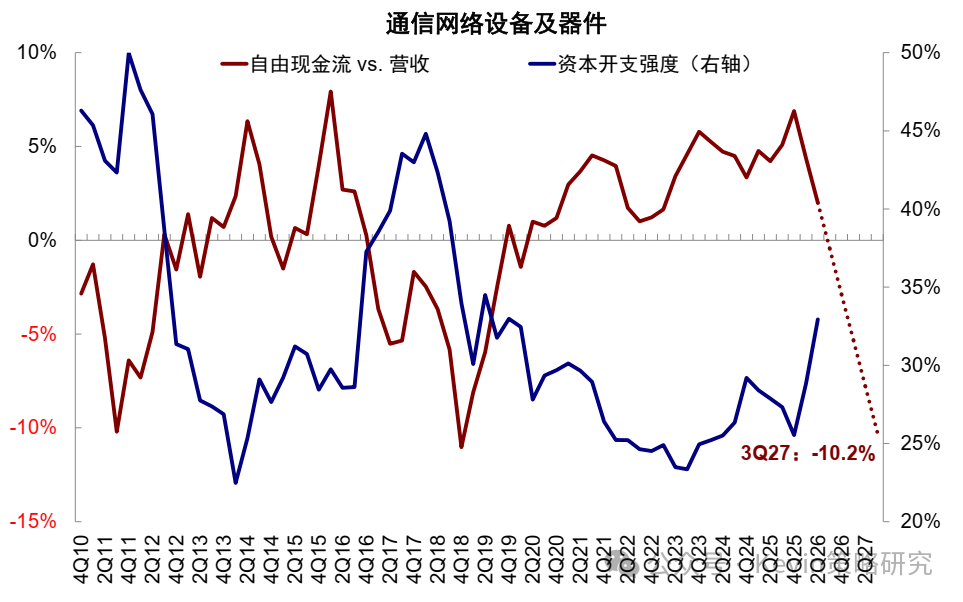
Cash flow has yet to fall to a critical threshold. The ratio of free cash flow to revenue (TTM) for optical modules was 2.0% in the second quarter. We found that the main rise in excess earnings ended when the ratio turned negative and deteriorated rapidly, about -10% (chart 21-24); it was linearly extrapolated at a rate of about 2.5 pcts per quarter, with an average quarterly decline of about 2.5 pcts in the past six months, roughly hitting the threshold value from 2Q27 to 3Q27 (Chart 25).
Chart 21: When excess electronic earnings finally reached a ratio of free cash flow to revenue of about -10%
Source: Wind, FactSet, CICC Research Division
Chart 22: When excess battery revenue finally reached about -10% of free cash flow to revenue
Source: Wind, FactSet, CICC Research Division
Chart 23: When excess revenue from wind power equipment finally reaches about -10% of free cash flow to revenue
Source: Wind, FactSet, CICC Research Division
Chart 24: The main rise in excess earnings from photovoltaic equipment ended when free cash flow turned negative and deteriorated rapidly
Source: Wind, FactSet, CICC Research Division
Figure 25: Under linear extrapolation, the ratio of optical module free cash flow to revenue may have hit the -10% threshold in 2Q27-3Q27
Source: Wind, FactSet, CICC Research Division
Beyond location, whether the market can go further depends on catalysis. The high point of AI hardware in June of this year was closer to the first peak of the M peak in NEV and PV markets from 2021 to 2022. At that time, when the first peak appeared, the sector retracted by about 30% to 40%, which is roughly equivalent to this round. If fundamentals continue to be realized, the market still has opportunities to recover, but clearly breaking through the previous high requires strong enough industrial catalysis. For example, AI demand continues to exceed expectations, and leading operating cash flow is sufficient to cover high capital expenses, similar to Anthropic's programming progress in the first quarter of this year.
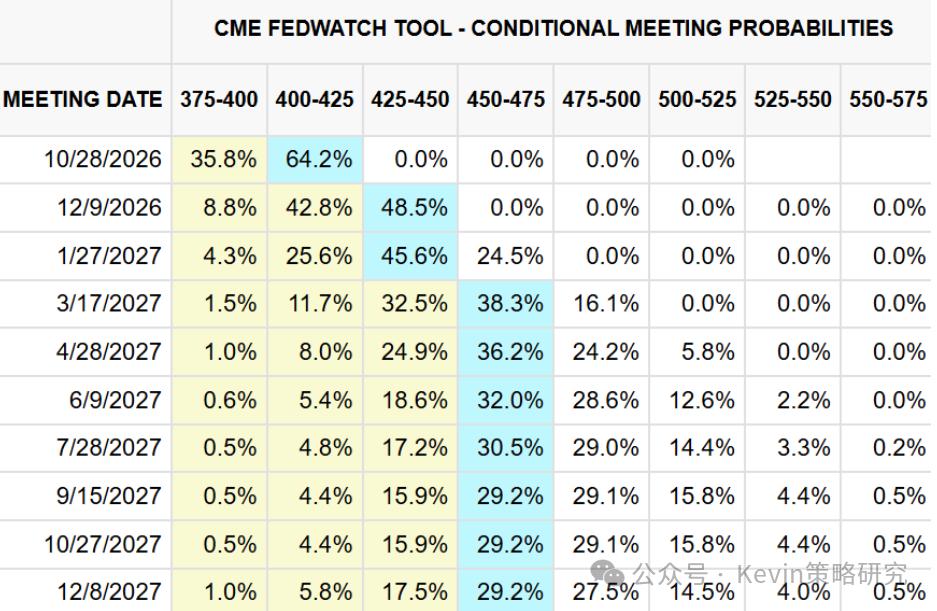
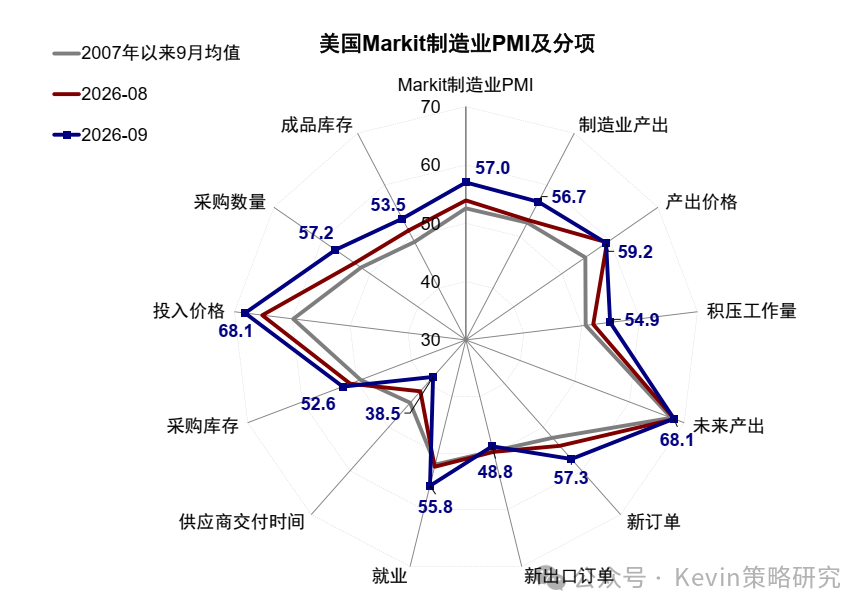
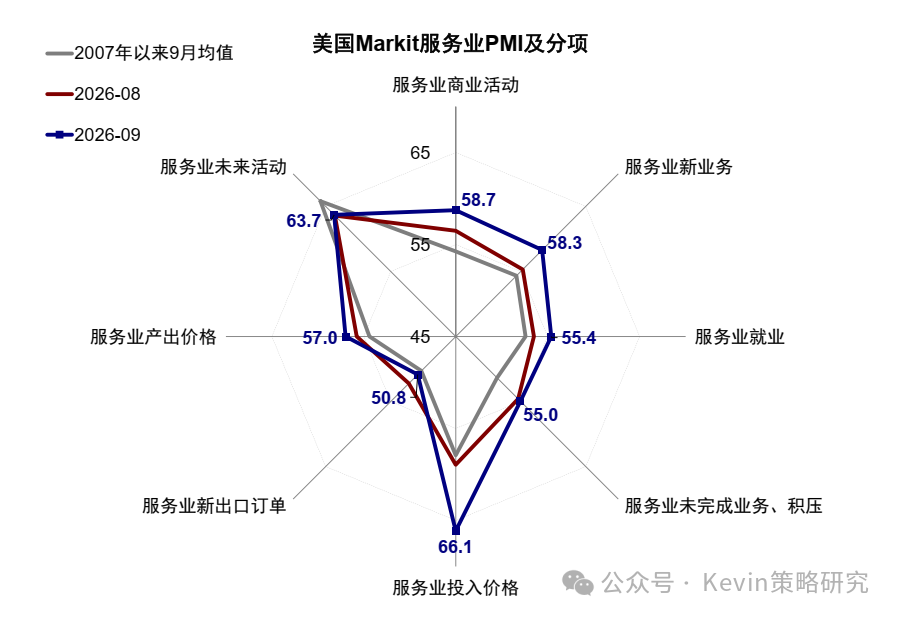
Next is the cycle. The logic is relatively simple; it depends on external demand and the Federal Reserve. At the level of external demand, the September Markit PMI data clearly exceeded expectations, confirming the US economic sentiment, which also means that external demand may still be sustainable (Chart 28-29). In terms of the Federal Reserve's monetary policy, the current market's interest rate hike expectations are still repeated. Referring to CME FedWatch, the market expects the probability that the Federal Reserve will raise interest rates by another 25 bp at the October meeting is about 64%, and the cumulative expectation of raising interest rates once or twice in December is roughly equivalent (Chart 26). However, we believe that this round is not a long round of interest rate hikes; the general direction is still to gradually peak.
Chart 26: The market expects the probability that the Federal Reserve will raise interest rates by another 25 bp at the October meeting is about 64%
Source: CME FedWatch, CICC Research Division
Chart 28: The overall US Markit manufacturing PMI exceeded expectations in September
Source: Haver, CICC Research Division
Chart 29: The overall PMI for the US Markit service sector exceeded expectations in September
Source: Haver, CICC Research Division
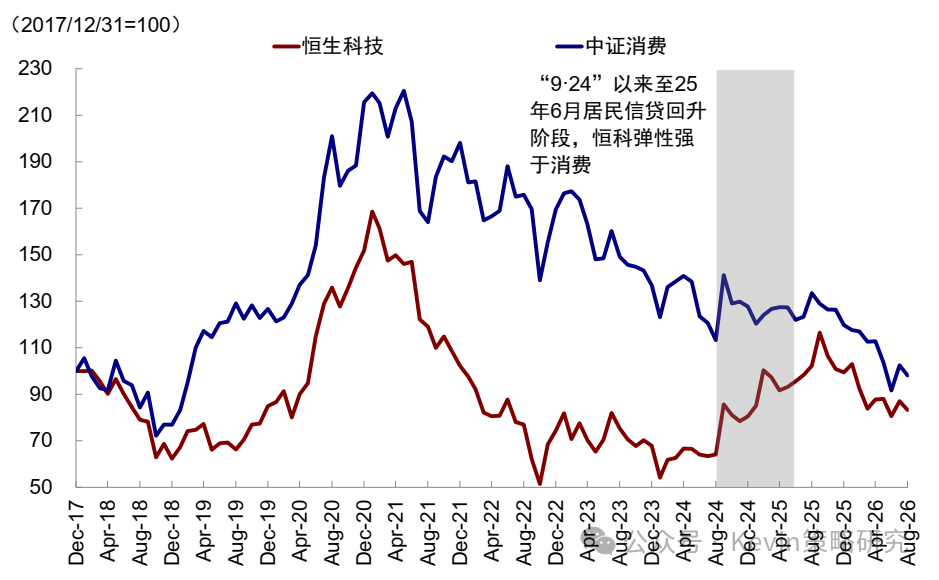
Once again, it's domestic demand; the key still depends on policy. Residents' credit is difficult to recover endogenously, and without effective policies, it will be difficult for consumption and domestic demand to break out of trending markets. If the policy is implemented and the consumer credit cycle is restarted, the option with higher allocation efficiency is Hang Seng Technology. Hengke itself can be viewed as a “big version of consumption”. At the stage where the consumer credit cycle is improving, Hengke's performance may be better than the consumer sector and more flexible. The example after “9/24” is an example (Chart 27).
Chart 27: Hengke itself can be viewed as a “big consumer”
Source: Wind, FactSet, CICC Research Division
Finally, if technology does not wait to be catalyzed, the cycle still faces disturbances, and domestic fiscal policies continue to be lacking, then the market will only be in the direction of dividends, which is roughly the state of the economy and market before “9/24.”
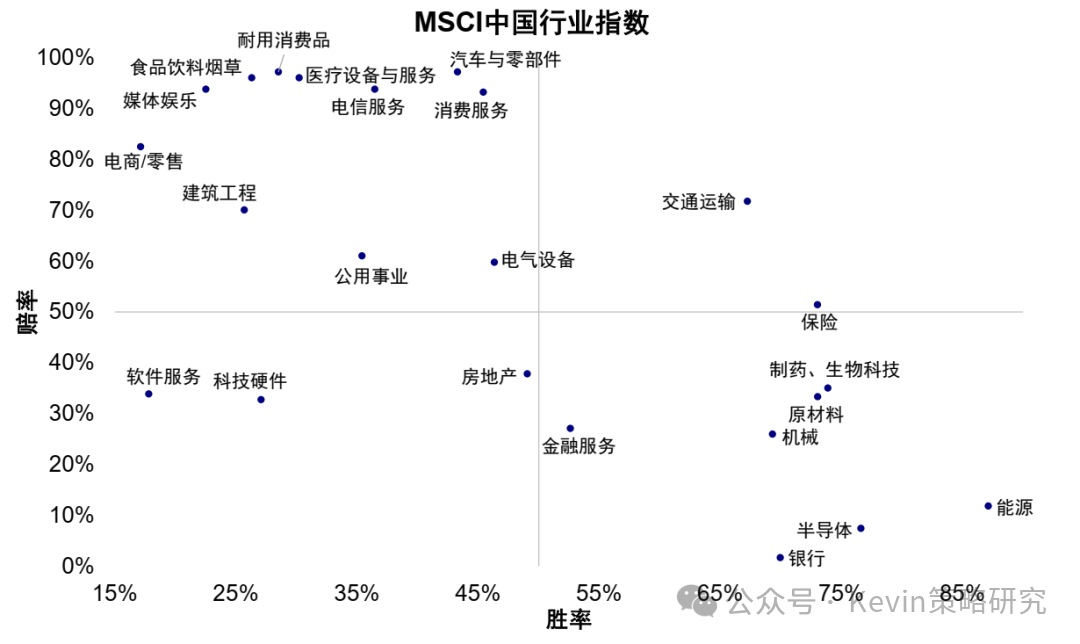
The results of our win odds framework are also consistent with the above analysis. As of September 26, the top five industries scored overall were energy, insurance, transportation, pharmaceuticals, and raw materials (Chart 30). Continued implementation of upstream price increases for energy and raw materials, improvements in profits for pharmaceuticals corresponding to innovative drugs going overseas. The improvement in the winning rate of transportation mainly comes from simultaneous fulfillment of orders and profits from shipping and corresponding shipping ports. Insurance accounts for a high increase in profits, and at the same time, it also has dividend attributes and not low odds. The semiconductor overall score is sixth. The winning rate is still at the top, but the odds are already clearly low. The market is expected to continue with fundamental support, and breaking through the previous high will require new industrial catalysts. The pan-consumer sector is a typical odds characteristic, which is not in line with weak demand and fiscal catalysis shown by mid-term reports and high frequency.
Chart 30: The top 5 industries ranked overall under the latest winning odds framework are: energy, insurance, transportation, pharmaceuticals, raw materials, and semiconductors rank sixth
Note: The index uses the MSCI China Industry Index
Source: Wind, FactSet, CICC Research Division
Looking ahead, the main events worth watching in the fourth quarter are: first, technological progress, especially Anthropic's potential listing plan and its three-quarter report; second, changes in oil prices and the Federal Reserve's interest rate discussions in October and November; third, fiscal policy, especially the Central Economic Work Conference at the end of the year; and fourth, geopolitical factors such as the US midterm elections.