
Is StepStone Group (STEP) Already Priced For Its Sales Growth?
StepStone Group shares have had a mixed run in recent years, with a solid multi year gain sitting alongside a much weaker stretch in 2024, which puts the spotlight on whether the current price really lines up with what the business generates in sales. For anyone considering the stock today, the key issue is how that recent share performance interacts with the revenue base that supports it.
- Over the past 3 years the stock is up 56.2%, so a lot of investor confidence has already been expressed in StepStone Group's ability to turn its sales engine into long term value.
- Recent news around StepStone Group's expansion across private markets and secondaries can affect how investors think about future fee revenue, timing of cash flows, and how much sales growth the current price already reflects.
- The analysts covering StepStone Group have run their own numbers. See what analysts think StepStone Group's shares could be worth.
The issue now is whether StepStone Group's recent share price, after a weaker patch this year, is well supported by its sales when judged against the Fair Ratio benchmark.
If you want to cross check StepStone Group against other businesses through the same sales lens, a focused stock screen built around 31 high quality undervalued stocks can be a useful next step.
Does StepStone Group Look Pricey on Sales?
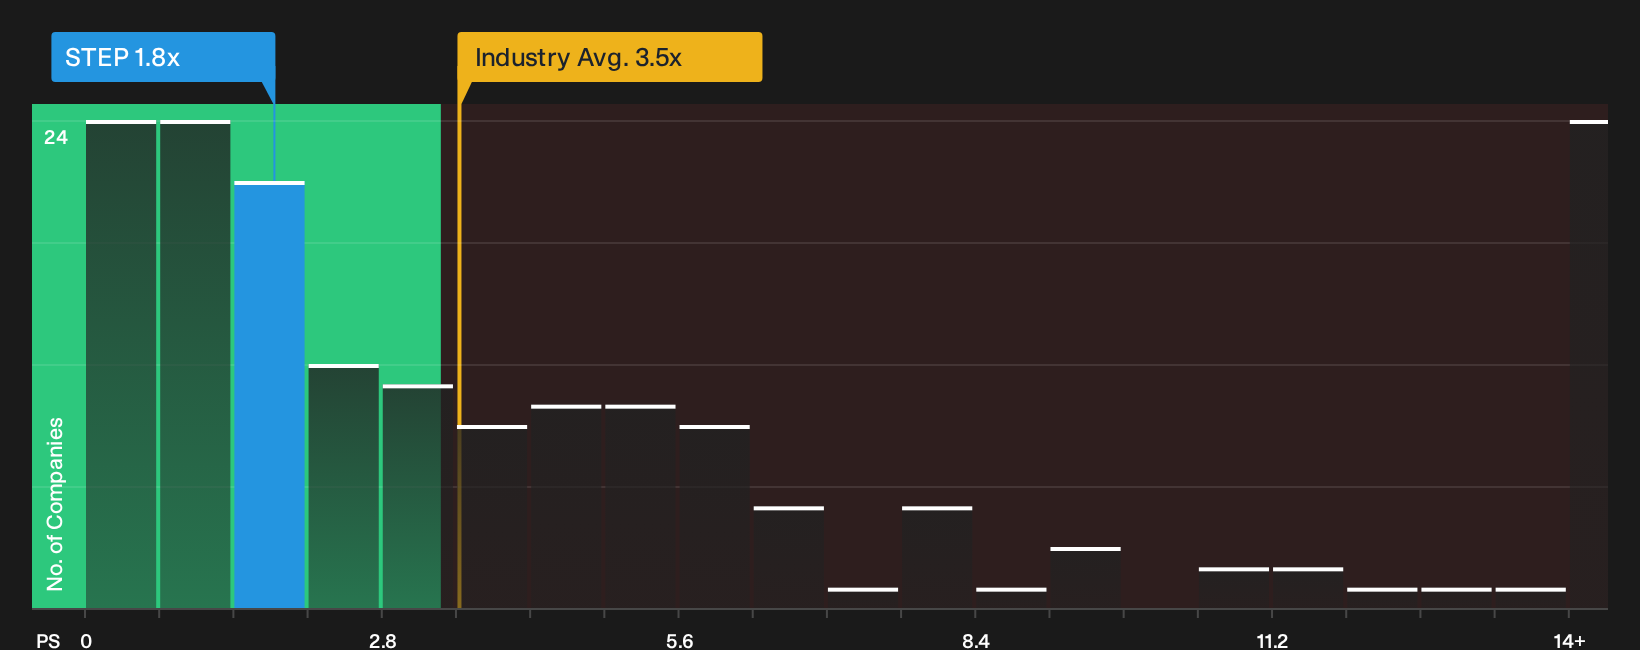
The P/S multiple suits StepStone Group because fee based asset managers are often better gauged on revenue than on near term earnings swings. StepStone Group trades on a P/S ratio of 1.8x, which is below both the Capital Markets industry average of 3.5x and the peer group at 4.5x. On this framework the Fair Ratio, which blends the firm’s growth profile, profitability, risk and size into a tailored benchmark, points to the shares looking overvalued despite that headline discount.
Recent commentary around StepStone Group’s global expansion and strong recent returns has helped sentiment. Yet the current 1.8x P/S still sits above what the Fair Ratio model suggests is warranted for its revenue base. That gap indicates that a lot of optimism around private markets and real estate secondaries is already reflected in the sales multiple, so anyone interested in the stock needs to judge whether the quality and durability of those fees justifies paying this level. Explore the numbers behind StepStone Group's P/S valuation.
The StepStone Group Narrative: What Would Justify Today's Price?
Simply Wall St Narratives for StepStone Group pick up where the P/S discussion leaves off and explain what kind of future growth, margins and earnings profile would need to occur for the stock to be worth materially more or less than it is today. Each scenario links a fair value estimate to a specific mix of potential catalysts and risks around StepStone Group's business, so you can track which storyline seems to be unfolding over time on the Community page.
A clear, written narrative on StepStone Group keeps all the moving parts around its private markets expansion, including the growth of real estate secondaries as a liquidity option, grounded in concrete numbers instead of headlines. As new data lands, that kind of explicit, assumption based view makes it easier to judge whether the firm’s actual fee streams and business mix are tracking the expectations currently implied in the share price.
Share your own Narrative for StepStone Group and set out the assumptions behind your valuation.
One more angle on StepStone Group that could change the story
Numbers only tell part of the story for StepStone Group, since the people setting priorities and the way they are rewarded can sharply influence how that growth and fee mix actually plays out. See who runs StepStone Group and how they are paid.
This article by Simply Wall St is general in nature. We provide commentary based on historical data and analyst forecasts only using an unbiased methodology and our articles are not intended to be financial advice. It does not constitute a recommendation to buy or sell any stock, and does not take account of your objectives, or your financial situation. We aim to bring you long-term focused analysis driven by fundamental data. Note that our analysis may not factor in the latest price-sensitive company announcements or qualitative material. Simply Wall St has no position in any stocks mentioned.
Have feedback on this article? Concerned about the content? Get in touch with us directly. Alternatively, email editorial-team@simplywallst.com