
XtalPi Holdings (SEHK:2228) Shares Moved, So What Is Behind The Attention?
XtalPi Holdings (SEHK:2228) has filed an IND with the U.S. FDA for KQTD-126, a gut-restricted pan-TRK inhibitor targeting chronic intestinal pain in IBS and IBD, highlighting its AI-driven drug discovery ambitions.
The recent IND filing and new collaborations with Stanford and Viva-Thera have arrived during a choppy stretch for XtalPi Holdings. The share price return is down 21.02% year to date and the 1-year total shareholder return has declined 44.51%. However, the stock has shown pockets of short-term momentum, with a 3.82% 30-day share price return and a 3.14% 90-day share price return, from a latest share price of HK$7.89.
Review how XtalPi Holdings compares with other AI-driven drug developers by exploring our hand-picked list of 132 healthcare AI stocks before the next wave of biotech catalysts reaches the market.
XtalPi Holdings now pairs a sharp drawdown with fresh clinical momentum, which raises a simple point: Does the current valuation still compensate you for the execution risk you are taking on from here?
Preferred Price-to-Sales of 42.7x: Is it justified?
XtalPi Holdings trades on a P/S of 42.7x, which is high relative to many listed peers, and that premium sits on top of a share price of HK$7.89 that has already seen a sharp drawdown over the past year.
The P/S ratio compares the market value of the equity to its trailing revenue and is often used for high-growth or loss-making healthcare and AI platform businesses where earnings are still negative. For XtalPi Holdings, this lens matters because the group reported CN¥679.17m in revenue while still posting a net loss of CN¥210.95m, so investors are effectively paying up for top-line growth and the potential for that revenue to translate into future profitability.
Forecast data points to annual revenue growth of 35.9% and earnings growth that is expected to be very large each year, with the business projected to move into profitability within three years. That growth profile helps explain why the market assigns a richer P/S multiple. Yet the fair P/S ratio estimate of 9.4x indicates a very strong gap between where the stock trades and a level the market could move towards if expectations around execution, funding risk or future returns were to reset.
On top of that, XtalPi Holdings screens as expensive against multiple benchmarks, with its 42.7x P/S well above the Asian Life Sciences industry average of 4.6x and ahead of a peer group average of 16.1x. This suggests investors are currently paying several turns more for each dollar of revenue than is typical even for similar AI-enabled drug discovery and life sciences platforms.
Explore the SWS fair ratio for XtalPi Holdings.
Result: Price-to-Sales of 42.7x (OVERVALUED)
Still, XtalPi Holdings faces clear pressure if high research spend delays profitability or if key AI discovery partnerships slow in deal flow or renewals.
Find out about the key risks to this XtalPi Holdings narrative.
Another View on XtalPi Holdings: Our DCF Model
The SWS DCF model points in the same direction as the rich P/S multiple. At a share price of HK$7.89, the stock trades well above an estimated future cash flow value of HK$0.56. That gap leaves little room if funding costs rise or pipeline milestones slip.
For investors weighing whether that premium is worth it, Look into how the SWS DCF model arrives at its fair value.
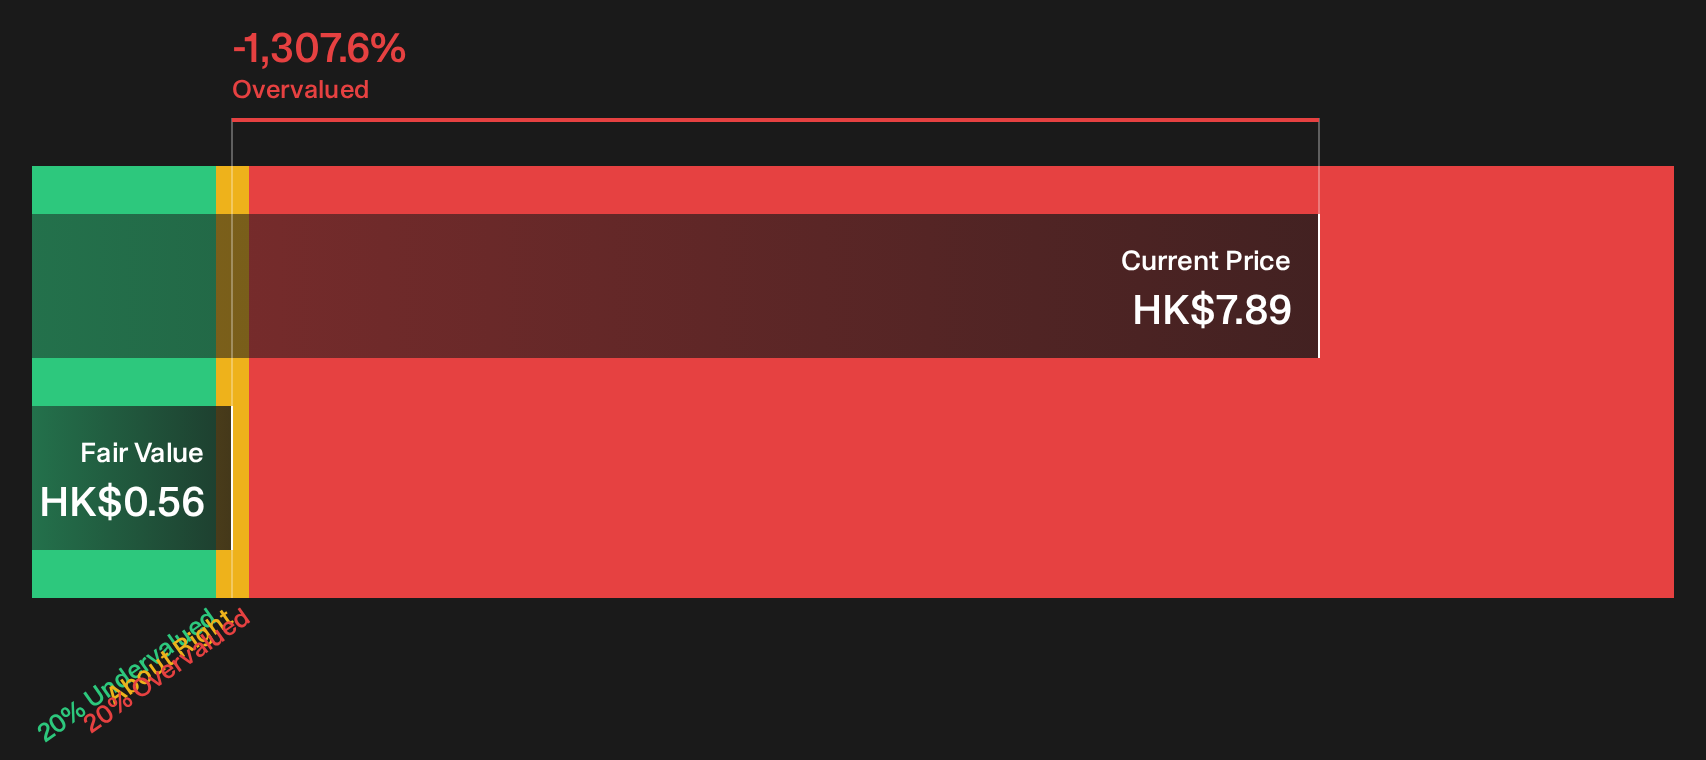
Simply Wall St performs a discounted cash flow (DCF) on every stock in the world every day (check out XtalPi Holdings for example). We show the entire calculation in full. You can track the result in your watchlist or portfolio and be alerted when this changes, or use our stock screener to discover 198 high quality undervalued stocks. If you save a screener we even alert you when new companies match - so you never miss a potential opportunity.
Next Steps
If the tone so far feels cautious, that is by design. You still need to weigh the data against your own tolerance for risk. Spend a few minutes reviewing the upside case in the 1 key reward.
Looking for more investment ideas beyond XtalPi Holdings?
Do not stop your research at XtalPi Holdings. Broaden your watchlist with fresh ideas that match your goals, risk profile and income needs.
- Target value opportunities that pair quality with pricing support by scanning our 198 high quality undervalued stocks to see which businesses line up with your expectations.
- Strengthen capital preservation by reviewing the 226 resilient stocks with low risk scores to identify resilience when market volatility picks up.
- Build a cash flow stream by searching through the 162 dividend fortresses to find higher yielding companies with robust payout profiles.
This article by Simply Wall St is general in nature. We provide commentary based on historical data and analyst forecasts only using an unbiased methodology and our articles are not intended to be financial advice. It does not constitute a recommendation to buy or sell any stock, and does not take account of your objectives, or your financial situation. We aim to bring you long-term focused analysis driven by fundamental data. Note that our analysis may not factor in the latest price-sensitive company announcements or qualitative material. Simply Wall St has no position in any stocks mentioned.
Have feedback on this article? Concerned about the content? Get in touch with us directly. Alternatively, email editorial-team@simplywallst.com