
3 Global Stocks That May Be Trading Below Estimated Value
As global markets navigate the complexities of rising inflation and interest rates, investors are keenly observing shifts in economic activity and sector performance. With growth stocks showing resilience amid these conditions, identifying undervalued opportunities becomes crucial for those looking to capitalize on potential market inefficiencies. In this context, understanding the intrinsic value of stocks can offer insights into which companies might be trading below their estimated worth.
Top 10 Undervalued Stocks Based On Cash Flows
| Name | Current Price | Fair Value (Est) | Discount (Est) |
| Shinhan Financial Group (KOSE:A055550) | ₩106400.00 | ₩202577.10 | 47.5% |
| Kumagai GumiLtd (TSE:1861) | ¥1263.00 | ¥2412.10 | 47.6% |
| Kingnet Network (SZSE:002517) | CN¥16.03 | CN¥31.48 | 49.1% |
| Industrias Peñoles. de (BMV:PE&OLES *) | MX$896.19 | MX$1682.17 | 46.7% |
| Ichikoh Industries (TSE:7244) | ¥558.00 | ¥1077.09 | 48.2% |
| Double Medical Technology (SZSE:002901) | CN¥40.86 | CN¥79.33 | 48.5% |
| Cuckoo Holdings (KOSE:A192400) | ₩26950.00 | ₩50354.66 | 46.5% |
| China Coal Energy (SEHK:1898) | HK$10.51 | HK$20.10 | 47.7% |
| Apator (WSE:APT) | PLN24.80 | PLN48.88 | 49.3% |
| AK Medical Holdings (SEHK:1789) | HK$4.83 | HK$9.52 | 49.2% |
We're going to check out a few of the best picks from our screener tool.
Industrias Peñoles. de (BMV:PE&OLES *)
Overview: Industrias Peñoles, S.A.B. de C.V. is involved in the exploration, extraction, and sale of mineral concentrates and minerals across various international markets with a market cap of MX$356.21 billion.
Operations: The company's revenue segments include Metallurgical at $13.47 billion, Mines of Base Metals at $1.43 billion, and Mines of Precious Metals at $6.01 billion.
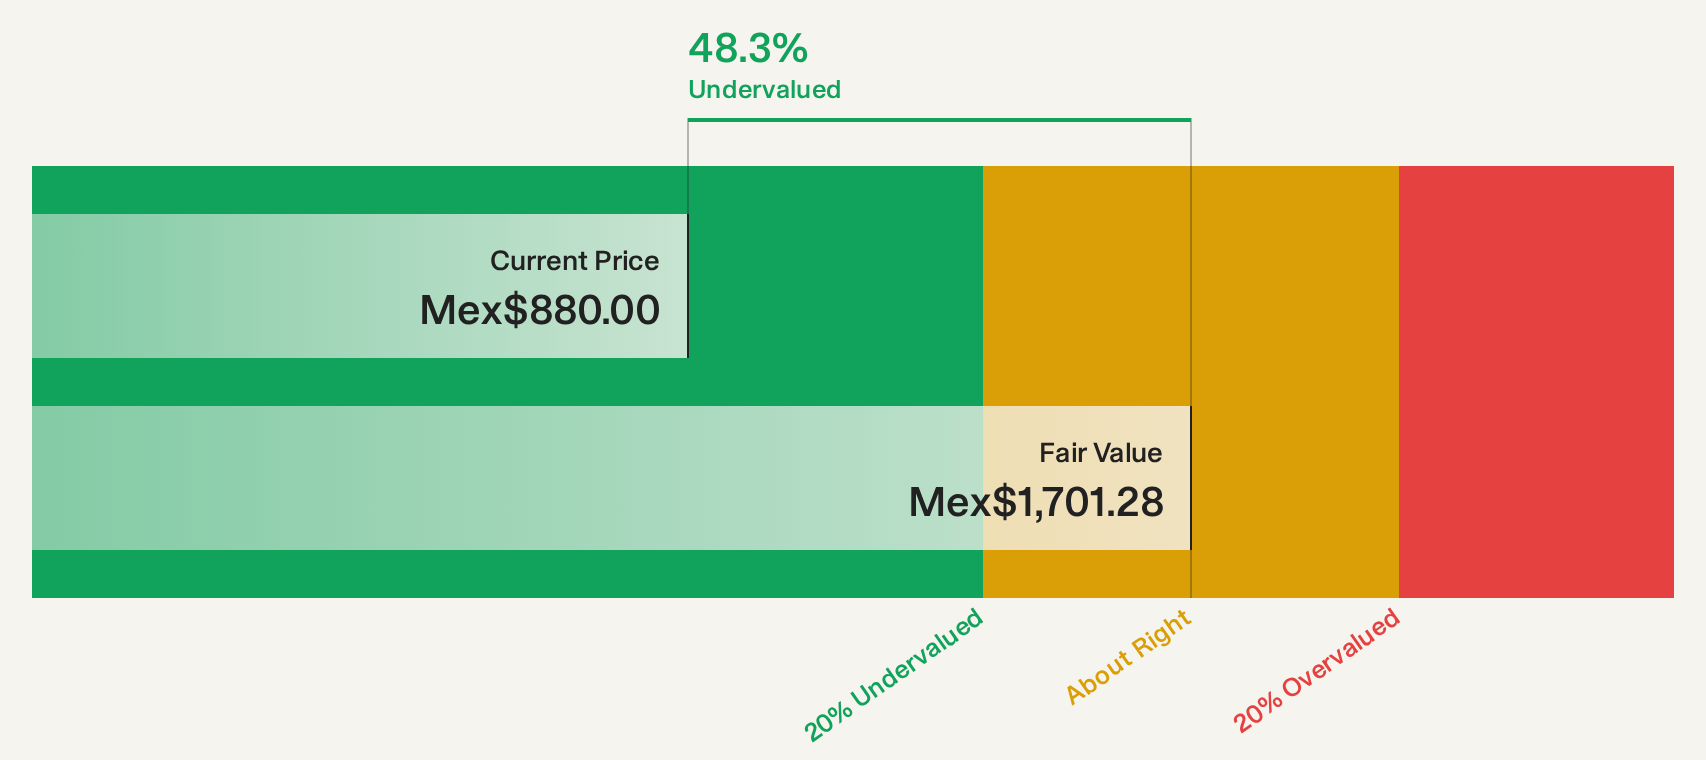
Estimated Discount To Fair Value: 46.7%
Industrias Peñoles appears undervalued, trading at 46.7% below its fair value and significantly under its future cash flow value of MX$1,682.17. Despite a volatile share price and forecasts of declining earnings and revenue over the next three years, recent earnings reports show substantial growth with net income reaching US$642.01 million in Q2 2026, up from US$333.25 million a year ago, highlighting robust cash flow potential amidst industry challenges.
- Our comprehensive growth report raises the possibility that Industrias Peñoles. de is poised for substantial financial growth.
- Get an in-depth perspective on Industrias Peñoles. de's balance sheet by reading our health report here.
Airbus (ENXTPA:AIR)
Overview: Airbus SE, along with its subsidiaries, is involved in the design, manufacture, and delivery of aeronautics and aerospace products, services, and solutions globally, with a market cap of approximately €150.76 billion.
Operations: The company's revenue segments include Airbus Helicopters generating €8.96 billion, Airbus Defence and Space contributing €13.91 billion, and the core Airbus segment, which encompasses holding functions and bank activities, accounting for €55.63 billion.
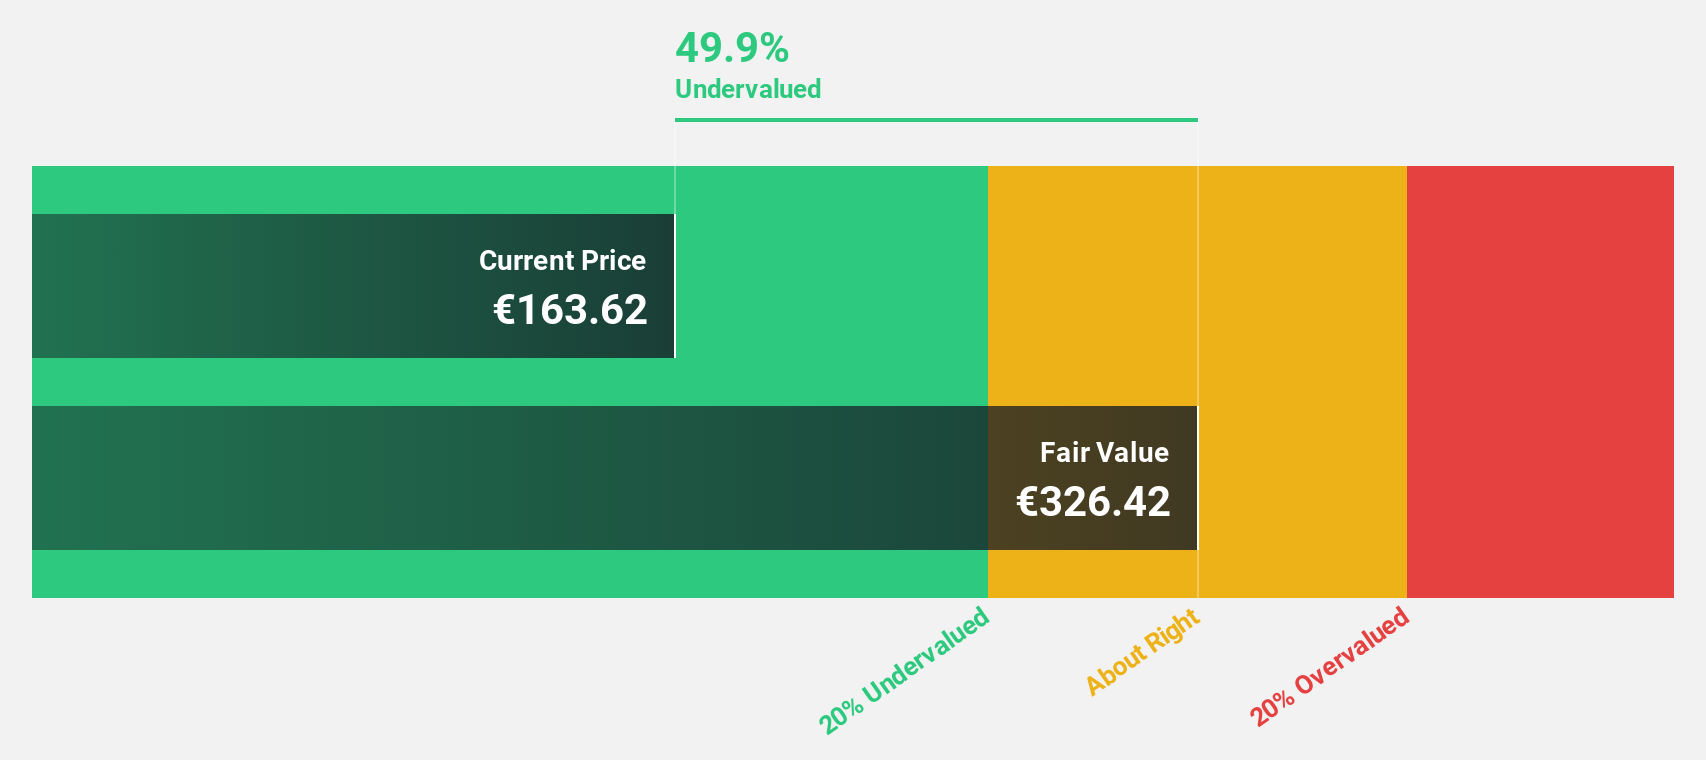
Estimated Discount To Fair Value: 30.2%
Airbus SE is trading at 30.2% below its estimated fair value, with a future cash flow valuation of €272.79 compared to its current price of €190.48, indicating it may be undervalued based on cash flows. Recent earnings show strong growth, with Q2 net income rising to €1.66 billion from €732 million a year ago. Strategic moves, such as the potential sale of its US satellite business and a share buyback program worth up to €5 billion, further enhance its financial positioning and shareholder value prospects amidst forecasted revenue growth surpassing the French market average.
- In light of our recent growth report, it seems possible that Airbus' financial performance will exceed current levels.
- Click to explore a detailed breakdown of our findings in Airbus' balance sheet health report.
Dassault Systèmes (ENXTPA:DSY)
Overview: Dassault Systèmes SE is a global provider of software solutions and services, with a market cap of €27.32 billion.
Operations: The company generates revenue of €6.21 billion from its software solutions and services worldwide.
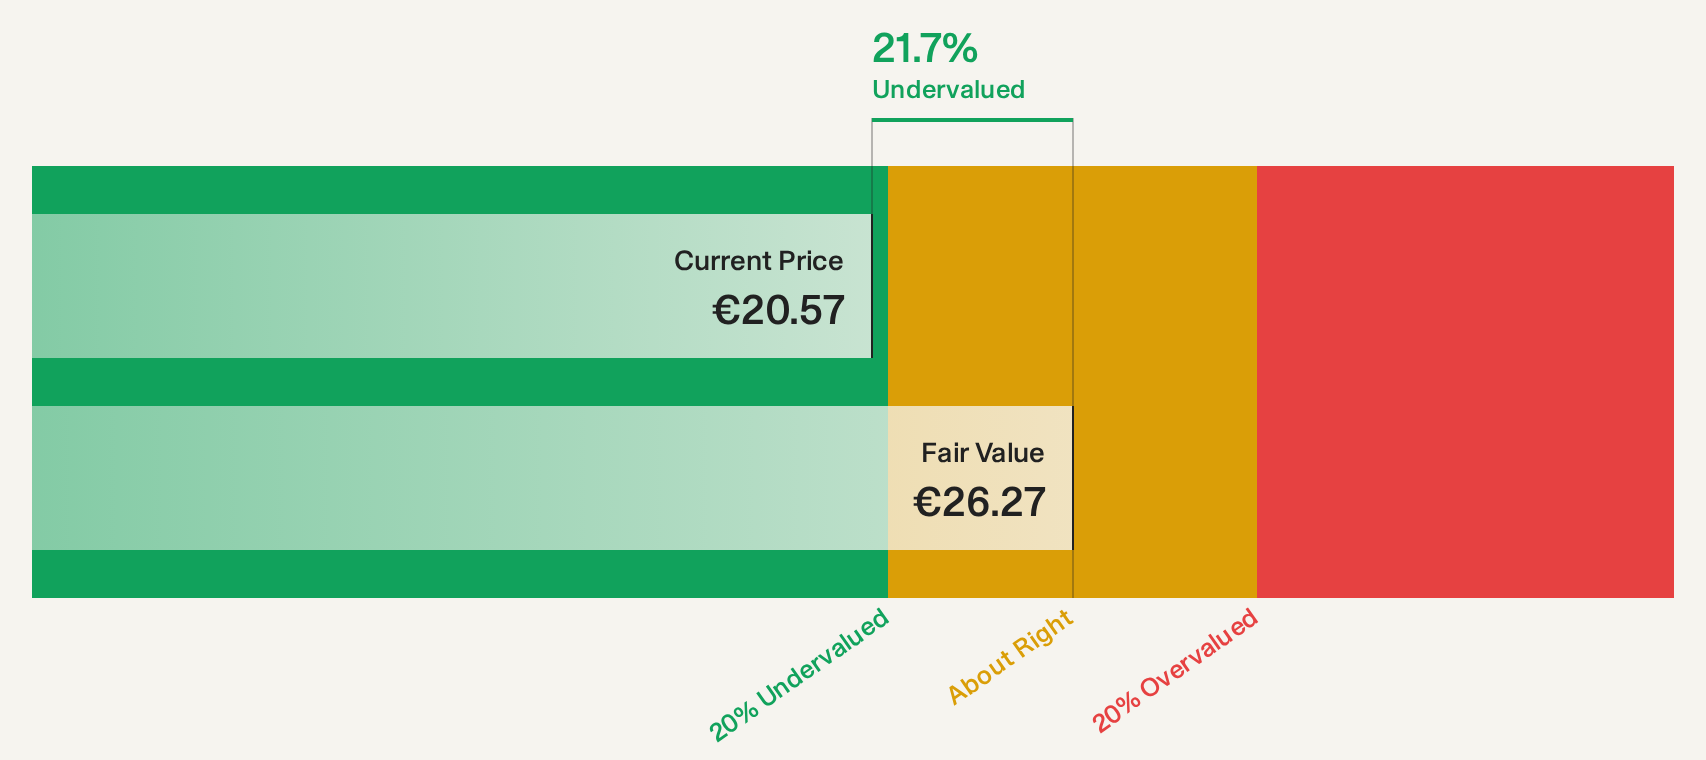
Estimated Discount To Fair Value: 21.4%
Dassault Systèmes is trading at €20.64, over 21% below its estimated future cash flow value of €26.27, suggesting undervaluation based on cash flows. Recent earnings show an increase in net income to €611.8 million from €484 million a year ago. Strategic partnerships, such as with Silvaco Group for semiconductor manufacturing workflows and SOLIZE PARTNERS for digital transformation in Japan, enhance its market positioning and operational efficiency amidst slower-than-market profit growth forecasts.
- Our expertly prepared growth report on Dassault Systèmes implies its future financial outlook may be stronger than recent results.
- Click here and access our complete balance sheet health report to understand the dynamics of Dassault Systèmes.
Turning Ideas Into Actions
- Discover the full array of 109 Undervalued Global Stocks Based On Cash Flows right here.
- Have a stake in these businesses? Integrate your holdings into Simply Wall St's portfolio for notifications and detailed stock reports.
- Unlock the power of informed investing with Simply Wall St, your free guide to navigating stock markets worldwide.
Interested In Other Possibilities?
- Explore high-performing small cap companies that haven't yet garnered significant analyst attention.
- Diversify your portfolio with solid dividend payers offering reliable income streams to weather potential market turbulence.
- Fuel your portfolio with companies showing strong growth potential, backed by optimistic outlooks both from analysts and management.
This article by Simply Wall St is general in nature. We provide commentary based on historical data and analyst forecasts only using an unbiased methodology and our articles are not intended to be financial advice. It does not constitute a recommendation to buy or sell any stock, and does not take account of your objectives, or your financial situation. We aim to bring you long-term focused analysis driven by fundamental data. Note that our analysis may not factor in the latest price-sensitive company announcements or qualitative material. Simply Wall St has no position in any stocks mentioned.
Have feedback on this article? Concerned about the content? Get in touch with us directly. Alternatively, email editorial-team@simplywallst.com