
Ørsted (CPSE:ORSTED) Could Be 59% Undervalued As Blackwater Solar Construction Starts
Ørsted (CPSE:ORSTED) has started construction on its 200 MW Blackwater Solar project in Roosevelt County, New Mexico, supported by a long-term power purchase agreement aimed at meeting rising industrial power demand.
For investors watching Ørsted, the Blackwater Solar announcement lands after a mixed price pattern. The share price is up 5.98% year to date yet has fallen 12.14% over 90 days, while the 1-year total shareholder return of 15.94% sits against a 5-year total shareholder loss of 70.38%. This suggests that near term momentum has improved, but longer term holders remain under pressure as sentiment and perceived risk around the business continue to reset.
Scan beyond Ørsted and this single project by reviewing a hand-picked pool of resilient power and infrastructure players in our 39 power grid technology and infrastructure stocks shaping how electricity gets delivered to end users.
Ørsted trades well below both analyst targets and some intrinsic value estimates after a sharp multi year slide. With the price recovering this year, where does a reasonable fair value range lie now?
Preferred Price-to-Sales of 2.1x for Ørsted: Is it justified?
On Simply Wall St’s checks, Ørsted screens as good value based on a P/S of 2.1x compared with both peers and the broader European renewable energy group. That multiple is being applied to a DKK135.65 share price that sits well below some fair value estimates and analyst targets, which points to the market pricing the stock more cautiously than those models.
The P/S ratio compares the market value of the equity with its revenue, so it is a straightforward way to see how much investors are paying for each unit of Ørsted’s top line. For a business focused on offshore and onshore wind, solar, and bioenergy, revenue can be a more stable reference point than earnings, especially while the group reports a loss of DKK3,118m and is still expected to move back into profitability over the next few years.
On these metrics, Ørsted is flagged as good value relative to both its direct peer group, where the average P/S is 12.9x, and the wider European renewable energy industry on 2.6x. That is a large gap to the peer average, which suggests the market is assigning a lower sales multiple despite forecasts for 4.1% annual revenue growth and 33.7% yearly earnings growth, alongside an internal DCF fair value estimate of DKK334.05 per share.
See what the numbers say about this price — find out in our valuation breakdown.
Result: Price-to-sales of 2.1x (UNDERVALUED)
Still, Ørsted faces pressure from its recent multi year share price fall and current net loss, which could limit how quickly sentiment and valuation reset.
Find out about the key risks to this Ørsted narrative.
Another View on Ørsted’s Value
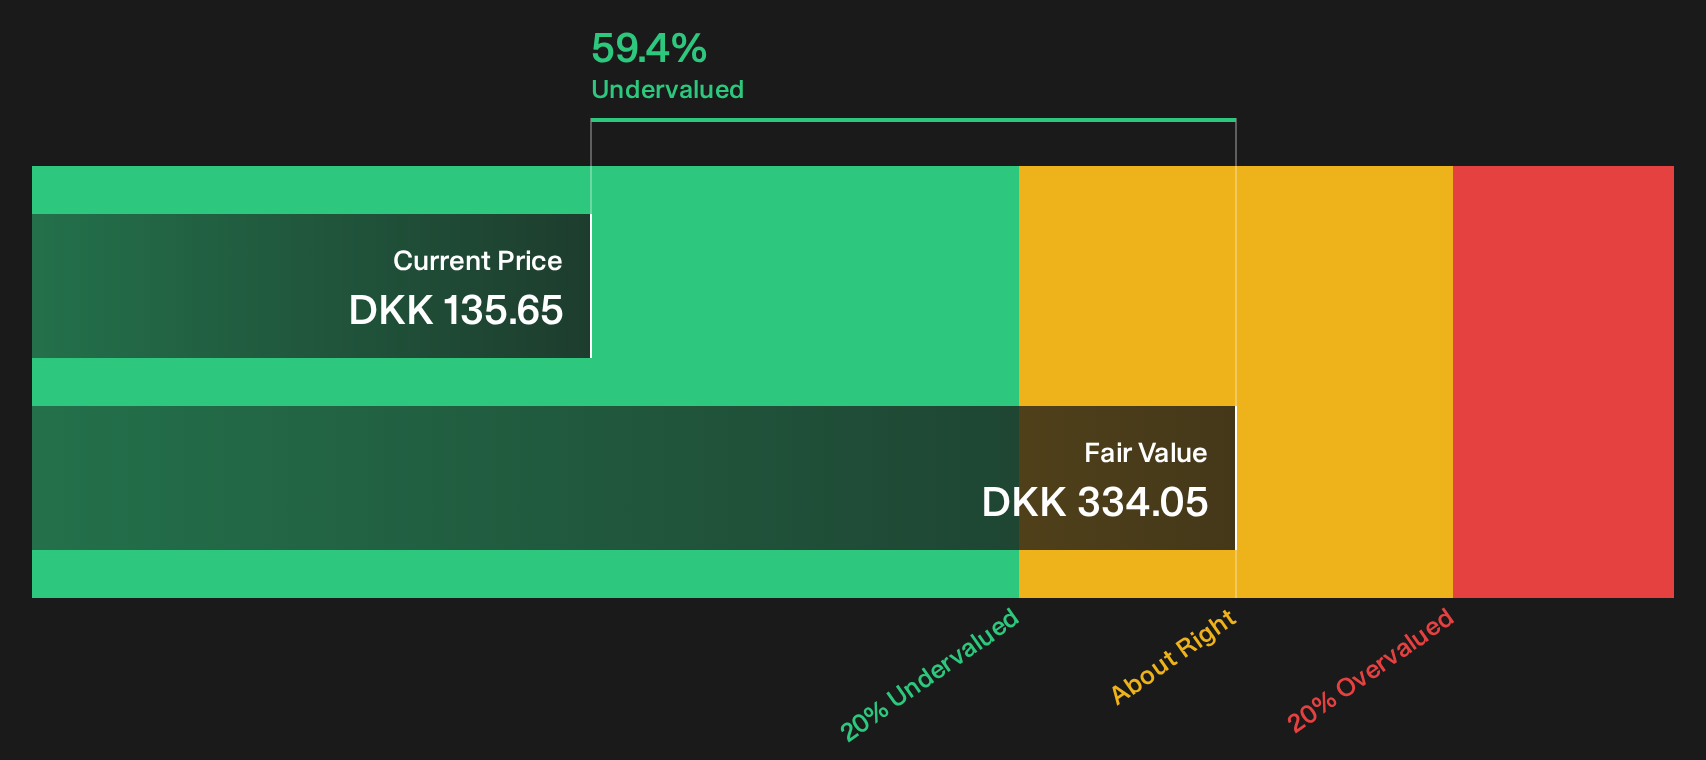
There is a second yardstick that matters for Ørsted. The SWS DCF model points to a fair value of DKK334.05 per share, while the current DKK135.65 price is trading at a 59.4% discount and screens as undervalued on this cash flow view. That is a wide gap for you to judge. Is the market being too harsh on future cash generation, or are the models too optimistic?
Look into how the SWS DCF model arrives at its fair value.
Simply Wall St performs a discounted cash flow (DCF) on every stock in the world every day (check out Ørsted for example). We show the entire calculation in full. You can track the result in your watchlist or portfolio and be alerted when this changes, or use our stock screener to discover 189 high quality undervalued stocks. If you save a screener we even alert you when new companies match - so you never miss a potential opportunity.
Next Steps
Mixed verdict on Ørsted so far? Use the figures, valuation checks, and sentiment flags as a starting point, then move quickly to weigh both sides of the story with 3 key rewards and 1 important warning sign
Looking for more Ørsted sized investment ideas?
Do not stop with Ørsted. Use the Simply Wall St Screener to quickly surface other opportunities that match your risk profile and return goals across sectors.
- Target resilience first by scanning companies with strong financial footing and low leverage using the list of solid balance sheet and fundamentals (205 results).
- Hunt for potential mispricings by focusing on businesses that our models flag as attractively valued through the 189 high quality undervalued stocks.
- Lock in income potential by reviewing higher yielding payers that clear quality checks via the 156 dividend fortresses.
This article by Simply Wall St is general in nature. We provide commentary based on historical data and analyst forecasts only using an unbiased methodology and our articles are not intended to be financial advice. It does not constitute a recommendation to buy or sell any stock, and does not take account of your objectives, or your financial situation. We aim to bring you long-term focused analysis driven by fundamental data. Note that our analysis may not factor in the latest price-sensitive company announcements or qualitative material. Simply Wall St has no position in any stocks mentioned.
Have feedback on this article? Concerned about the content? Get in touch with us directly. Alternatively, email editorial-team@simplywallst.com