
Ayalon Insurance (TASE:AYAL) Climbed, But What Is Behind The Fresh Attention?
Ayalon Insurance (TASE:AYAL) just took a concrete step toward resolving a long running class action. On 17 September 2026, the insurer and other defendants filed court motions seeking approval of compromise arrangements.
The legal update lands while Ayalon Insurance shares have climbed to ₪198.0, with a 30 day share price return of 15.25% and a year to date share price return of 127.59%, alongside a 1 year total shareholder return of 204.47% that indicates sustained momentum rather than a short lived bounce.
Spot similar legal overhang stories and strong price swings by scanning our hand picked 226 resilient stocks with low risk scores, which combines resilience with clearer balance sheet strength.That legal overhang now sits beside a share price that has more than doubled over 12 months. Are investors reacting to a cleaner outlook for Ayalon Insurance, or did sentiment simply race ahead of fundamentals as we value the business next?
Price-to-Earnings of 12.7x: Is it justified?
Ayalon Insurance now trades at ₪198.0, which equates to a P/E of 12.7x. That level sits above several peer markers, so the question is whether the richer tag is supported by the underlying record.
The P/E ratio compares the current share price to earnings per share. For an insurer like Ayalon Insurance, it captures how much investors are willing to pay for each unit of profit, and often reflects expectations around underwriting discipline, investment results, and capital allocation quality.
On the one hand, the stock changes hands at 12.7x earnings, which is below the wider IL market on 14.5x. That suggests the broader equity universe carries a higher earnings multiple than this insurer. On the other hand, Ayalon Insurance is described as expensive against its closest peer sets, with a P/E above both the direct peer average of 9x and the Asian insurance group on 11.3x. Those gaps indicate buyers in this share are paying a clear premium to sector comparables for each shekel of profit.
That split paints a sharp contrast. Relative to the overall IL market, the valuation looks restrained. Yet compared with specialist insurance peers, the same 12.7x P/E is meaningfully richer and suggests the market is assigning a different profile to Ayalon Insurance than to similar insurers.
See what the numbers say about this price — find out in our valuation breakdown.
Result: Price-to-Earnings of 12.7x (OVERVALUED)
Still, Ayalon Insurance faces two obvious pressure points: the unresolved class action outcome and any shift in insurance claims that squeezes current profitability.
Find out about the key risks to this Ayalon Insurance narrative.
Another view on Ayalon Insurance valuation
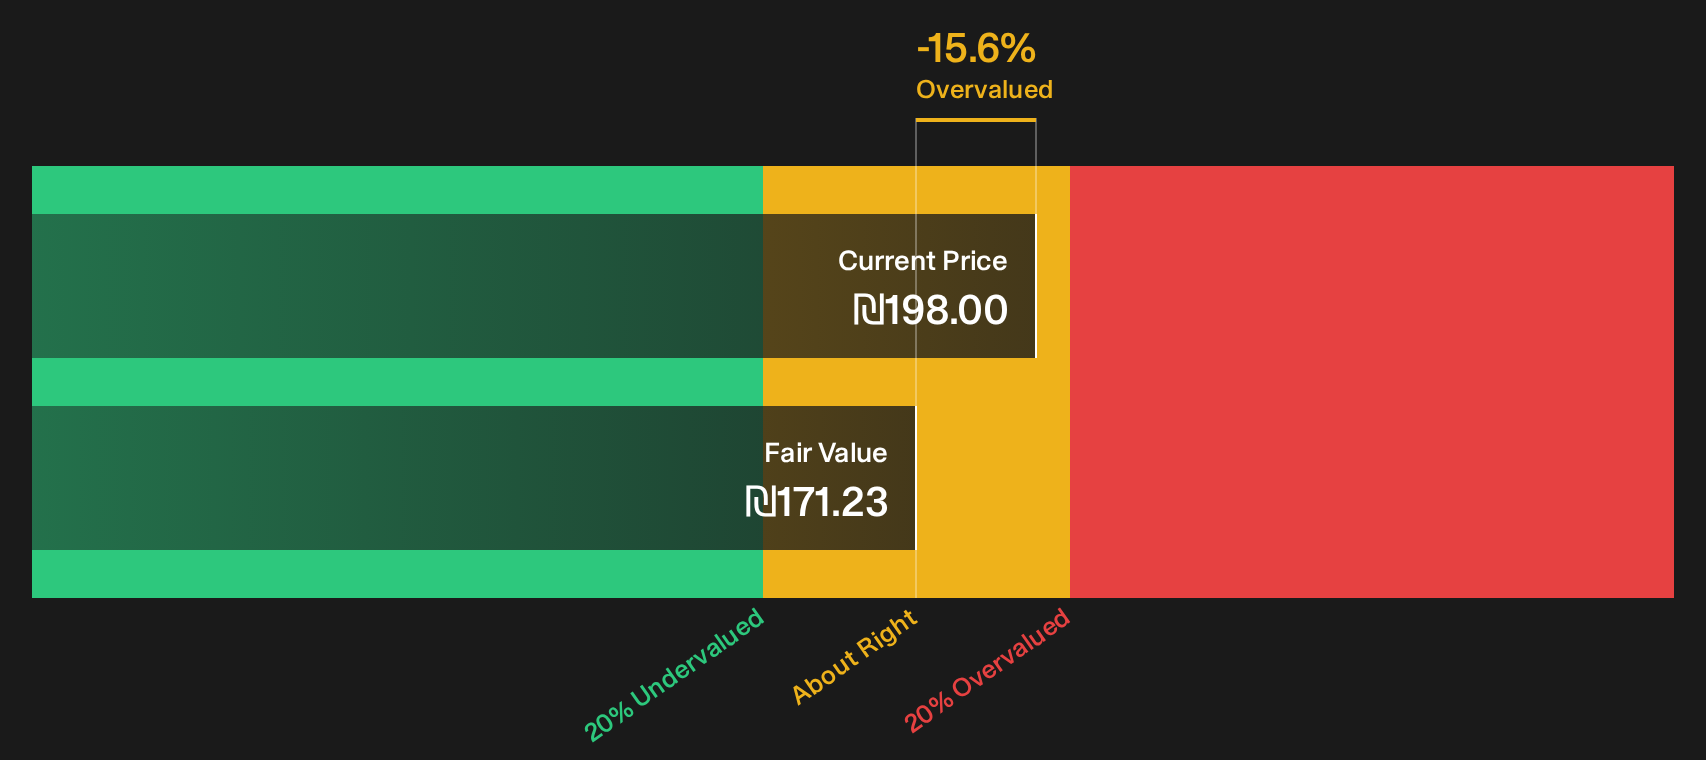
There is a second check on Ayalon Insurance that points the same way as the P/E work. Our DCF model puts the future cash flow value at about ₪171.23 per share, which is below the current ₪198.0 price and signals the stock screens as overvalued on this lens too. That leaves a simple question: Is the recent share price run already pricing in the cleaner legal picture and past profit growth, or is the DCF being too cautious about what comes next?
For readers who want to see how the cash flow based view is built step by step, Look into how the SWS DCF model arrives at its fair value.
Simply Wall St performs a discounted cash flow (DCF) on every stock in the world every day (check out Ayalon Insurance for example). We show the entire calculation in full. You can track the result in your watchlist or portfolio and be alerted when this changes, or use our stock screener to discover 189 high quality undervalued stocks. If you save a screener we even alert you when new companies match - so you never miss a potential opportunity.
Next Steps
Mixed signals on Ayalon Insurance so far. If you want to move fast and rely on your own judgment, start by weighing its 2 key rewards and 1 important warning sign
Looking for more Ayalon Insurance investment ideas?
If Ayalon Insurance has you thinking more broadly about opportunities, do not stop at one ticker. The right comparison set can change your whole perspective.
- Spot potential bargains early by scanning 189 high quality undervalued stocks that combine solid fundamentals with market prices that have yet to fully reflect them.
- Strengthen your peace of mind by focusing on companies in the list of solid balance sheet and fundamentals (205 results) that pair healthier finances with fewer obvious red flags.
- Get ahead of the crowd by reviewing the 616 high quality undiscovered gems where quality metrics already line up even if attention from other investors has not.
This article by Simply Wall St is general in nature. We provide commentary based on historical data and analyst forecasts only using an unbiased methodology and our articles are not intended to be financial advice. It does not constitute a recommendation to buy or sell any stock, and does not take account of your objectives, or your financial situation. We aim to bring you long-term focused analysis driven by fundamental data. Note that our analysis may not factor in the latest price-sensitive company announcements or qualitative material. Simply Wall St has no position in any stocks mentioned.
Have feedback on this article? Concerned about the content? Get in touch with us directly. Alternatively, email editorial-team@simplywallst.com