
Nine Dragons Paper (Holdings) (SEHK:2689) Following Strong Results And Dividend Is It Still Cheap
Nine Dragons Paper (Holdings) (SEHK:2689) just paired a final dividend proposal of RMB 0.1 per share with full year 2026 results that showed higher sales, net income and basic earnings per share.
The stronger full year 2026 figures and proposed payout arrive after a choppy share price stretch for Nine Dragons Paper (Holdings). The 30 day share price return is down 17.96% and the 90 day share price return is down 20.53%, even as the 1 year total shareholder return is 1.91% and the 3 year total shareholder return is 36.46%. This suggests that longer term holders have still come out ahead while shorter term momentum has faded.
Compare Nine Dragons Paper (Holdings) with peers that have resilient earnings and dividend profiles by scanning our curated list of list of solid balance sheet and fundamentals (205 results)
So is the recent slide in Nine Dragons Paper (Holdings) simply sentiment catching up with an extended run, or has pricing moved out of line with what the latest earnings and dividend signal about the business?
Price-to-Earnings of 6.3x: Is it justified?
On the latest close at HK$5.60, Nine Dragons Paper (Holdings) changes hands on a P/E of 6.3x, which suggests the market is pricing its recent earnings recovery at a lower level than many Hong Kong listings.
P/E compares the current share price to earnings per share and gives a simple sense of how much investors are willing to pay for each dollar of profit. For a mature packaging and paper producer like Nine Dragons Paper (Holdings), that yardstick helps frame what the market might be implying about the durability of its 4.8% net profit margin and the forecast 13.7% yearly earnings growth.
Based on the statements provided, this P/E of 6.3x is described as good value relative to peers and the broader market. That description indicates investors are not paying up for the recent 102.6% year-on-year earnings expansion, even though those profits are assessed as high quality and are projected to keep growing.
The comparison becomes more pronounced at the industry level. The same 6.3x multiple sits well below the Asian forestry industry average of 15.5x and under the peer average of 9.1x, which points to a material valuation gap. The estimated fair P/E ratio of 10x is also well above where the stock trades, which hints at a level the market could move towards if sentiment and earnings stay aligned with current expectations.
Explore the SWS fair ratio for Nine Dragons Paper (Holdings).
Result: Price-to-earnings of 6.3x (UNDERVALUED)
Still, Nine Dragons Paper (Holdings) faces risks if packaging demand softens in the PRC or if input costs squeeze its 4.8% net profit margin.
Find out about the key risks to this Nine Dragons Paper (Holdings) narrative.
Another View on Nine Dragons Paper (Holdings) Valuation
While the 6.3x P/E points to good value, the SWS DCF model tells a different story. On that framework, Nine Dragons Paper (Holdings) at HK$5.60 trades above an estimated future cash flow value of HK$4.07, which suggests the stock screens as overvalued on this method. Which lens do you trust more when cash flows and earnings point in different directions?
Look into how the SWS DCF model arrives at its fair value.
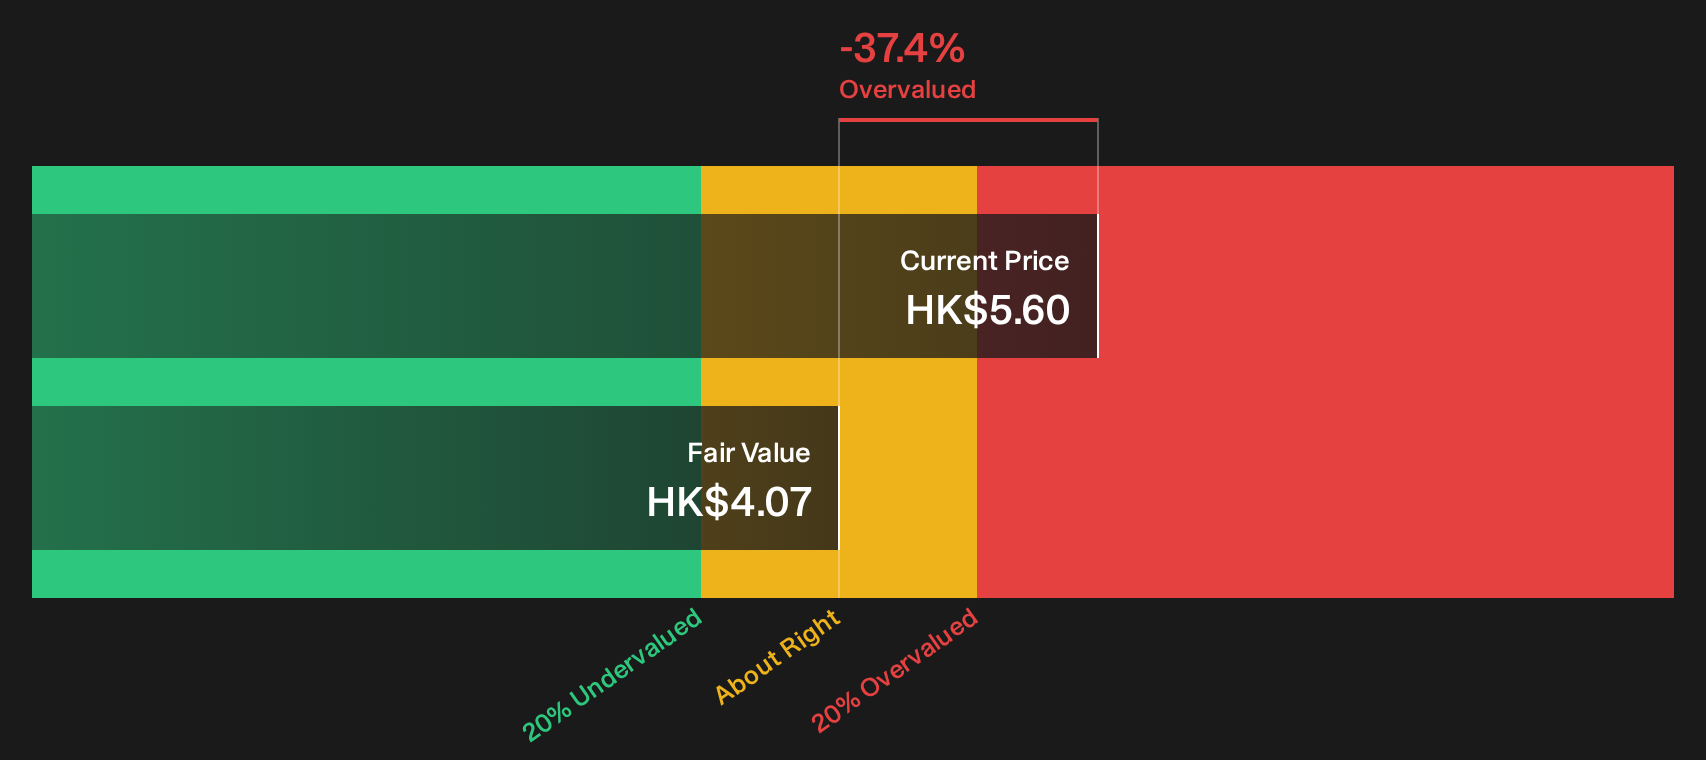
Simply Wall St performs a discounted cash flow (DCF) on every stock in the world every day (check out Nine Dragons Paper (Holdings) for example). We show the entire calculation in full. You can track the result in your watchlist or portfolio and be alerted when this changes, or use our stock screener to discover 190 high quality undervalued stocks. If you save a screener we even alert you when new companies match - so you never miss a potential opportunity.
Next Steps
If this mix of low P/E signals, stronger earnings and a softer Nine Dragons Paper (Holdings) share price feels conflicted, treat it as a prompt to inspect the details yourself and move quickly while the information is fresh. To weigh the balance between the concerns and the upside, start with our profile of 4 key rewards and 1 important warning sign
Looking for more investment ideas beyond Nine Dragons Paper (Holdings)?
Do not stop at Nine Dragons Paper (Holdings). If you want a fuller opportunity set, broaden your watchlist now while prices and narratives are still shifting.
- Target resilient balance sheets and steady fundamentals by scanning our curated list of solid balance sheet and fundamentals (205 results) for businesses that aim to keep financial risk in check.
- Hunt for mispriced quality by reviewing the 140 high quality undervalued stocks that filters for companies combining stronger cash flows with sturdier balance sheets.
- Build a potential income stream by assessing the 70 dividend fortresses that focuses on higher yielding payers with an emphasis on resilience.
This article by Simply Wall St is general in nature. We provide commentary based on historical data and analyst forecasts only using an unbiased methodology and our articles are not intended to be financial advice. It does not constitute a recommendation to buy or sell any stock, and does not take account of your objectives, or your financial situation. We aim to bring you long-term focused analysis driven by fundamental data. Note that our analysis may not factor in the latest price-sensitive company announcements or qualitative material. Simply Wall St has no position in any stocks mentioned.
Have feedback on this article? Concerned about the content? Get in touch with us directly. Alternatively, email editorial-team@simplywallst.com