
Is Chorus (NZSE:CNU) Undervalued After Its Governance Changes And Final Dividend Update?
Chorus (NZSE:CNU) has put a significant governance change on the table. The board wants shareholder approval to revoke the current constitution, remove ownership limits, and align proxy rules with updated NZX requirements.
These proposed governance shifts land after a mixed stretch for Chorus investors. The share price is NZ$8.35, with the 30 day share price return down 4.9% and the year to date share price return down 11.55%, while the 5 year total shareholder return of 70.84% shows a very different long run picture. Recent focus has also been on the FY26 final dividend of NZ$0.36 per share. This helps frame how investors weigh current income against the changing risk profile around future ownership and control.
Compare Chorus' governance and dividend profile with a curated group of resilient income plays by scanning the 157 dividend fortresses that keep yield front and center.
Recent weakness in Chorus shares against a much stronger five year record leaves a simple puzzle. Are investors reassessing the fibre utility itself, or is sentiment just swinging around the same cash flows as before?
Most Popular Narrative: 12% Undervalued
Chorus is trading at NZ$8.35, while the most followed narrative pegs fair value at around NZ$9.46, which frames the current governance debate against a modest implied discount.
Monetization of Chorus' excess fiber capacity and new wholesale products (like expanded data center connectivity and smart infrastructure solutions) are driving incremental revenue streams and margin expansion, supported by broader national endorsements for fiber expansion, positioning Chorus to benefit directly from surging demand for broadband infrastructure linked to emerging technologies and digital lifestyles.
See why 11 investors see Chorus as 12% undervalued.
Result: Fair Value of NZ$9.46 (UNDERVALUED)
Still, the Chorus narrative frays quickly if fixed wireless keeps siphoning off price sensitive users, or if regulators tighten pricing caps and squeeze future earnings power.
Find out about the key risks to this Chorus narrative.
Another View On Chorus Valuation
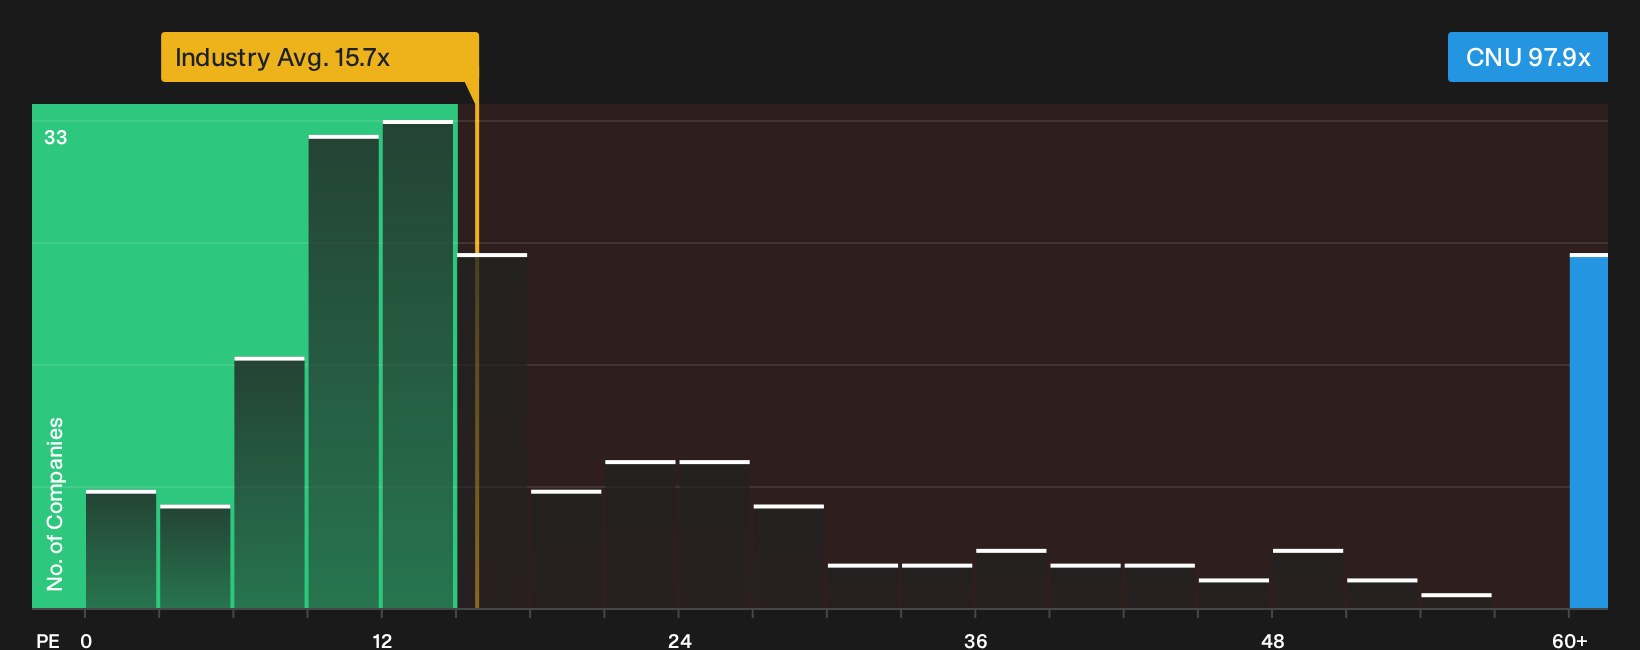
That NZ$9.46 fair value narrative leans on future earnings projections and discount rate assumptions. The plain P/E picture tells a different story. Chorus trades on about 97.9x earnings, while peers sit near 23.3x and the fair ratio sits closer to 37.6x. That gap points to meaningful valuation risk rather than a simple discount. This raises the question of which signal may be more informative.
For a closer look at what the current P/E might be implying about expectations, See what the numbers say about this price — find out in our valuation breakdown.
Next Steps
Curious whether the mixed message on Chorus leaves more upside or downside on the table? Act quickly, review the full picture, and consider both the 3 key rewards and 2 important warning signs.
Looking for more investment ideas beyond Chorus?
If Chorus has you thinking harder about valuation and governance, use this momentum and line up a few fresh ideas before the next move catches you off guard.
- Target long term compounding potential by scanning the 191 high quality undervalued stocks that combine quality fundamentals with pricing that still looks reasonable.
- Prioritise resilience in tougher markets by reviewing the 224 resilient stocks with low risk scores that emphasise stronger balance sheets and more stable risk profiles.
- Hunt for early stage opportunities with solid footing by checking the 123 elite penny stocks with strong financials that pair smaller size with healthier financial markers.
This article by Simply Wall St is general in nature. We provide commentary based on historical data and analyst forecasts only using an unbiased methodology and our articles are not intended to be financial advice. It does not constitute a recommendation to buy or sell any stock, and does not take account of your objectives, or your financial situation. We aim to bring you long-term focused analysis driven by fundamental data. Note that our analysis may not factor in the latest price-sensitive company announcements or qualitative material. Simply Wall St has no position in any stocks mentioned.
Have feedback on this article? Concerned about the content? Get in touch with us directly. Alternatively, email editorial-team@simplywallst.com