
Micronics Japan (TSE:6871) Joins FTSE All World, Is The Stock Now Too Expensive?
Micronics Japan (TSE:6871) has been added to the FTSE All-World Index in USD terms, a change that can attract passive capital from index trackers and broaden the shareholder base.
The FTSE All-World inclusion lands after a sharp run, with Micronics Japan’s share price up 20.79% over the past 30 days and 92.89% year to date. Its 1-year total shareholder return of 134.14% and very large 5-year total shareholder return indicate powerful longer term momentum that recent gains have accelerated.
Scan beyond Micronics Japan and see how other fast moving chip and testing specialists stack up in the 92 robotics and automation stocks.
Micronics Japan now combines strong recent business growth with a share price that has raced ahead of analyst targets. Is this still a solid entry on fundamentals, or increasingly a momentum story on a full valuation?
Preferred P/E of 30.9x: Is it justified for Micronics Japan?
Micronics Japan now trades on a P/E of 30.9x, which places a rich price on the last close of ¥14,930 compared both to peers and the wider semiconductor group.
The P/E ratio compares what investors pay for each unit of current earnings. For a testing and probe card specialist like Micronics Japan, a higher multiple often reflects expectations that profit growth can continue at a healthy clip rather than stall.
Here, earnings growth has been strong, with profit up 89.4% over the past year and an average of 17.8% per year over five years. Forecasts also point to earnings rising 24.9% per year and revenue growing 23% per year, both ahead of the broader JP market. That kind of profile can help explain why buyers are willing to accept a higher P/E. However, the current 30.9x figure still embeds a lot of optimism at today’s price.
Compared to the JP Semiconductor industry average P/E of 22x, Micronics Japan trades on a materially richer valuation. It also exceeds the peer average of 26.3x and even sits above an estimated fair P/E of 29.5x. This suggests the multiple may have moved beyond the level that regression analysis points to as more sustainable.
Explore the SWS fair ratio for Micronics Japan.
Result: Price-to-earnings of 30.9x (OVERVALUED)
Still, Micronics Japan faces two clear risks that could puncture this momentum story: earnings missing bullish forecasts, and any reset in valuation expectations after such a strong run.
Find out about the key risks to this Micronics Japan narrative.
Another View of Micronics Japan’s Value
While the current 30.9x P/E makes Micronics Japan look expensive next to the 22x industry average, the SWS DCF model paints an even starker picture. On that cash flow view, an estimate of ¥2,226.44 per share versus a market price of ¥14,930 points to a rich valuation.
DCF and multiples rarely agree perfectly. When one suggests a slight premium and the other flags a big gap, which signal do you trust more for your own risk tolerance? Look into how the SWS DCF model arrives at its fair value.
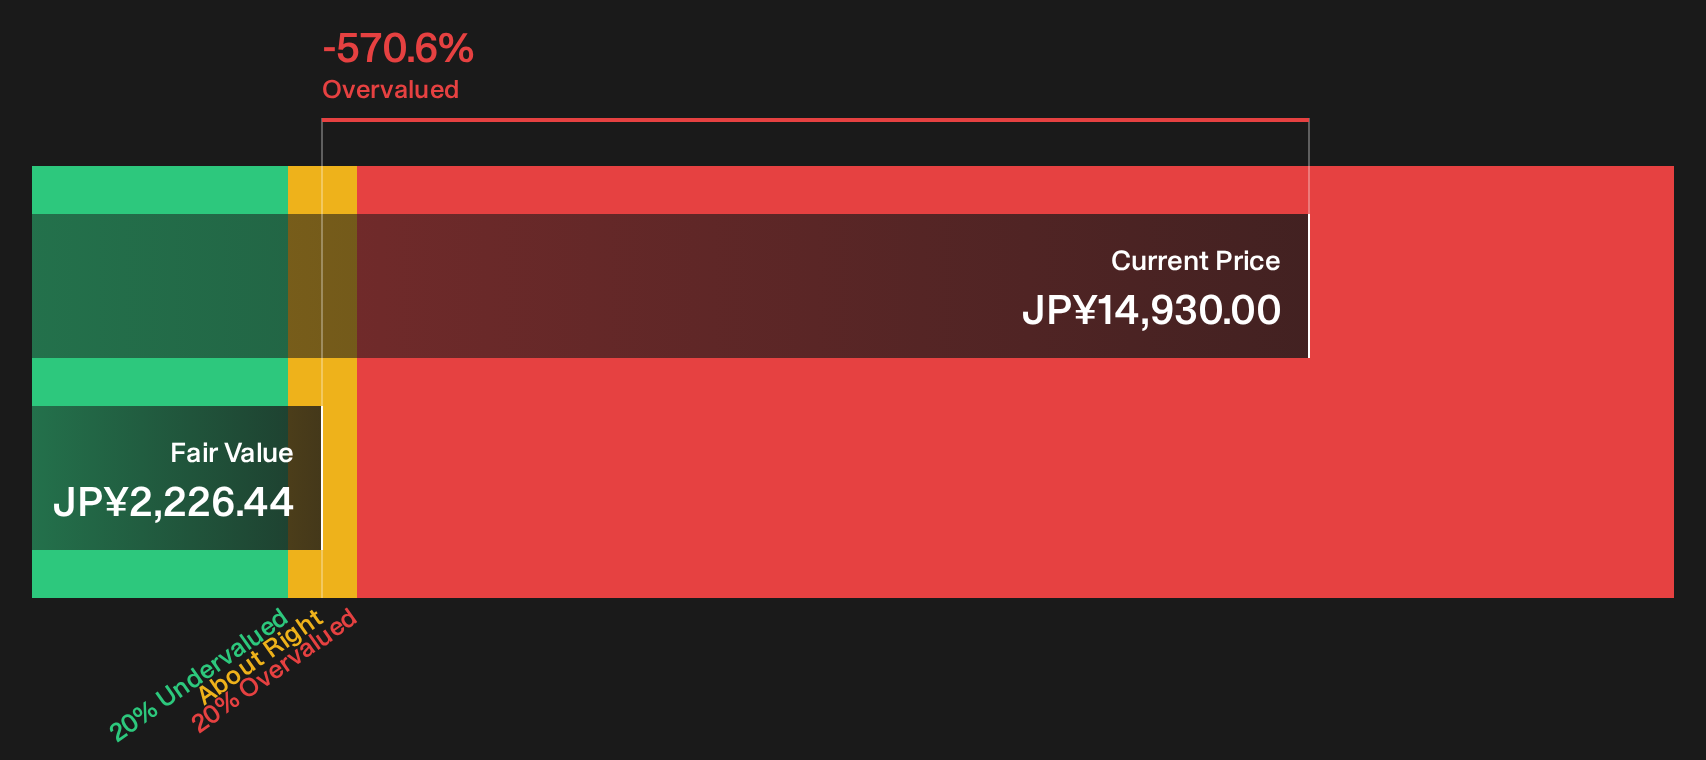
Simply Wall St performs a discounted cash flow (DCF) on every stock in the world every day (check out Micronics Japan for example). We show the entire calculation in full. You can track the result in your watchlist or portfolio and be alerted when this changes, or use our stock screener to discover 17 high quality undervalued stocks. If you save a screener we even alert you when new companies match - so you never miss a potential opportunity.
Next Steps
Sentiment around Micronics Japan is clearly mixed, with strong recent returns but a valuation that already bakes in a lot of good news. Move quickly, examine the numbers for yourself, and pressure test both the upside and the downside. To weigh those trade offs in one place, start with the 2 key rewards and 1 important warning sign.
Looking for more Micronics Japan style investment ideas?
If Micronics Japan has sharpened your focus on quality and timing, do not stop here. Use the screener to surface fresh, high conviction opportunities before the crowd.
- Target stronger quality at a fair price by scanning companies that screen as 17 high quality undervalued stocks.
- Prioritize resilience and aim to sleep better at night by filtering for a list of solid balance sheet and fundamentals (23 results).
- Hunt for under-the-radar potential by zeroing in on a 76 high quality undiscovered gems.
This article by Simply Wall St is general in nature. We provide commentary based on historical data and analyst forecasts only using an unbiased methodology and our articles are not intended to be financial advice. It does not constitute a recommendation to buy or sell any stock, and does not take account of your objectives, or your financial situation. We aim to bring you long-term focused analysis driven by fundamental data. Note that our analysis may not factor in the latest price-sensitive company announcements or qualitative material. Simply Wall St has no position in any stocks mentioned.
Have feedback on this article? Concerned about the content? Get in touch with us directly. Alternatively, email editorial-team@simplywallst.com