
Lumine Group (TSXV:LMN) Gains On Acquisitions And Buyback, Is The Stock Too Pricey?
Lumine Group (TSXV:LMN) moved back onto investor radars after a 4.22% share price gain on October 1, 2026, following fresh data on acquisitions and an active buyback program.
The recent 7.16% 1 day share price return and move to CA$21.86 comes after months of mixed sentiment, with the 30 day share price return down 10.37% and the year to date share price return down 19.04%, while the 3 year total shareholder return of 12.10% contrasts sharply with a 1 year total shareholder return that has fallen 48.53%. This suggests Lumine Group is seeing short term momentum rebuild as investors react to acquisitions and the buyback, against a weaker longer term experience for many holders.
Scan beyond Lumine Group to see how other software and tech platforms with rebuilding momentum and active capital return programs line up in our hand picked 9 high quality undiscovered gems
Lumine Group just bounced hard after a tough year, and the buyback plus acquisitions are back in focus. Is this the moment to lean in, or does waiting for a cleaner entry make more sense once valuation is on the table next?
Price-to-Earnings of 35.7x for Lumine Group: Is it justified?
Lumine Group now trades on a P/E of 35.7x, which puts a premium tag on CA$21.86 compared to both its own fair ratio and the broader software group.
The P/E ratio compares the share price with earnings per share. For a software business like Lumine Group, this is often used as a shorthand for how much investors are willing to pay today for each dollar of current profit, based on expectations for future growth and stability.
Here, the market is paying 35.7x earnings while the estimated fair P/E is 27.9x. That indicates investors are assigning a richer multiple than the level the fair ratio suggests, even though LMN is also flagged as trading 56% below an internal fair value estimate and below a CA$49.71 future cash flow value in the SWS DCF model. Revenue is forecast to rise 26.3% per year and earnings are projected to grow 19.5% per year, which helps explain why some investors may accept a higher earnings multiple even after a difficult 1 year total return.
Against the wider North American Software industry average P/E of 31.6x, Lumine Group carries an even steeper valuation. That means the stock is priced more aggressively than the sector, while also sitting above the 27.9x level that regression analysis suggests the multiple could move toward if sentiment cools.
Explore the SWS fair ratio for Lumine Group.
Result: Price-to-Earnings of 35.7x (OVERVALUED)
Still, the Lumine Group story runs into risk if acquisition execution stumbles or if the active buyback fails to offset recent double digit share price declines.
Find out about the key risks to this Lumine Group narrative.
Another View on Lumine Group’s Value
The first look at Lumine Group focused on its P/E of 35.7x, which points to a rich tag. A second lens tells a very different story. Our DCF model values the shares at CA$49.71, with the current CA$21.86 price flagged as trading 56% below that future cash flow estimate.
This gap frames the risk and potential payoff in a very different way. If the SWS DCF model is closer to reality than the earnings multiple, then the bigger question for you is which signal you trust more when the next bout of volatility hits.
Look into how the SWS DCF model arrives at its fair value.
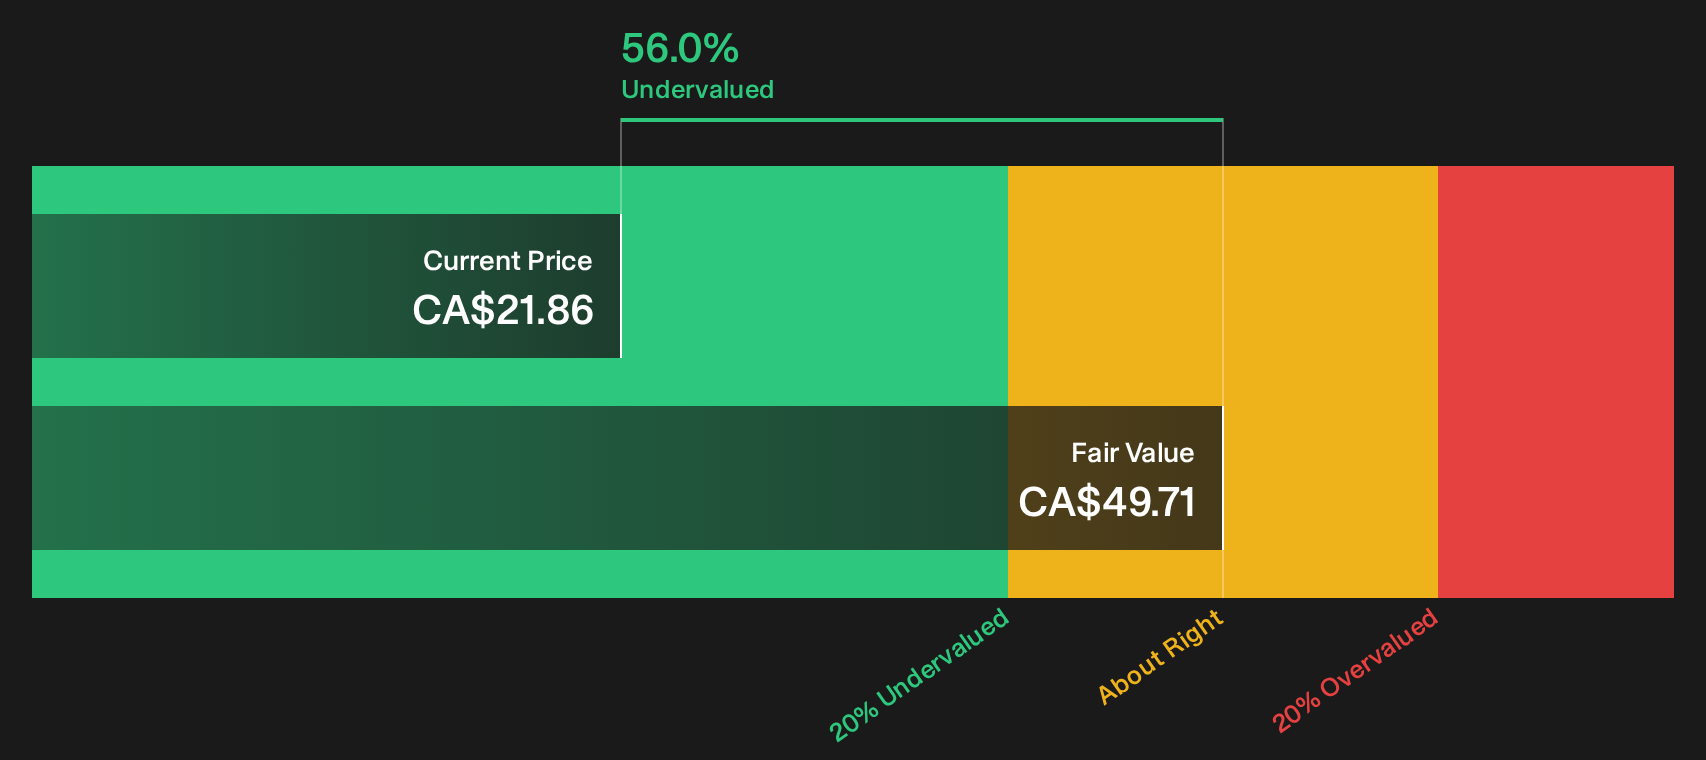
Simply Wall St performs a discounted cash flow (DCF) on every stock in the world every day (check out Lumine Group for example). We show the entire calculation in full. You can track the result in your watchlist or portfolio and be alerted when this changes, or use our stock screener to discover 5 high quality undervalued stocks. If you save a screener we even alert you when new companies match - so you never miss a potential opportunity.
Next Steps
If the mixed tone around Lumine Group leaves you torn, act while the data is fresh and test the thesis yourself using the 3 key rewards.
Looking for more Lumine Group style investment ideas?
Do not stop at Lumine Group. If you want a wider field of opportunities, use the Simply Wall Street Screener to pressure test ideas before committing real capital.
- Target businesses with strong cash generation and sensible pricing by scanning for potential value opportunities in the 5 high quality undervalued stocks.
- Prioritise resilience and sleep easier at night by focusing on companies screened in the 9 resilient stocks with low risk scores.
- Zero in on firms with healthy balance sheets and solid fundamentals using the list of solid balance sheet and fundamentals (7 results).
This article by Simply Wall St is general in nature. We provide commentary based on historical data and analyst forecasts only using an unbiased methodology and our articles are not intended to be financial advice. It does not constitute a recommendation to buy or sell any stock, and does not take account of your objectives, or your financial situation. We aim to bring you long-term focused analysis driven by fundamental data. Note that our analysis may not factor in the latest price-sensitive company announcements or qualitative material. Simply Wall St has no position in any stocks mentioned.
Have feedback on this article? Concerned about the content? Get in touch with us directly. Alternatively, email editorial-team@simplywallst.com