
How Investors Are Reacting To Hubbell (HUBB) Free Cash Flow Improvement
- Hubbell has delivered multi year revenue expansion and earnings per share growth, with a higher free cash flow margin that gives the business more financial flexibility.
- The combination of improving cash generation and a solid operational record positions Hubbell to fund investment, integration and potential shareholder returns without relying solely on new financing.
- We will now look at how Hubbell's free cash flow margin may reshape the longer term investment narrative around the business.
Scan beyond Hubbell and line up other cash generative industrials using the carefully filtered list of solid balance sheet and fundamentals (25 results) as a starting universe.
Hubbell Investment Narrative Recap
For an investor to stay in Hubbell, the belief has to be that demand for grid hardening, high voltage transmission and data center infrastructure can keep the order book healthy while the business converts more of that revenue into free cash flow. The latest update on stronger cash margins supports that view because it gives Hubbell more room to keep investing without stretching the balance sheet further.
The near term swing factor is whether NSI integration and Electrical Solutions margins track management’s plans while interest costs move higher. The biggest operational risk is that leverage and higher net interest expense pressure earnings if cash generation softens or deleveraging is slower than expected. In that scenario, the recent free cash flow strength would matter less.
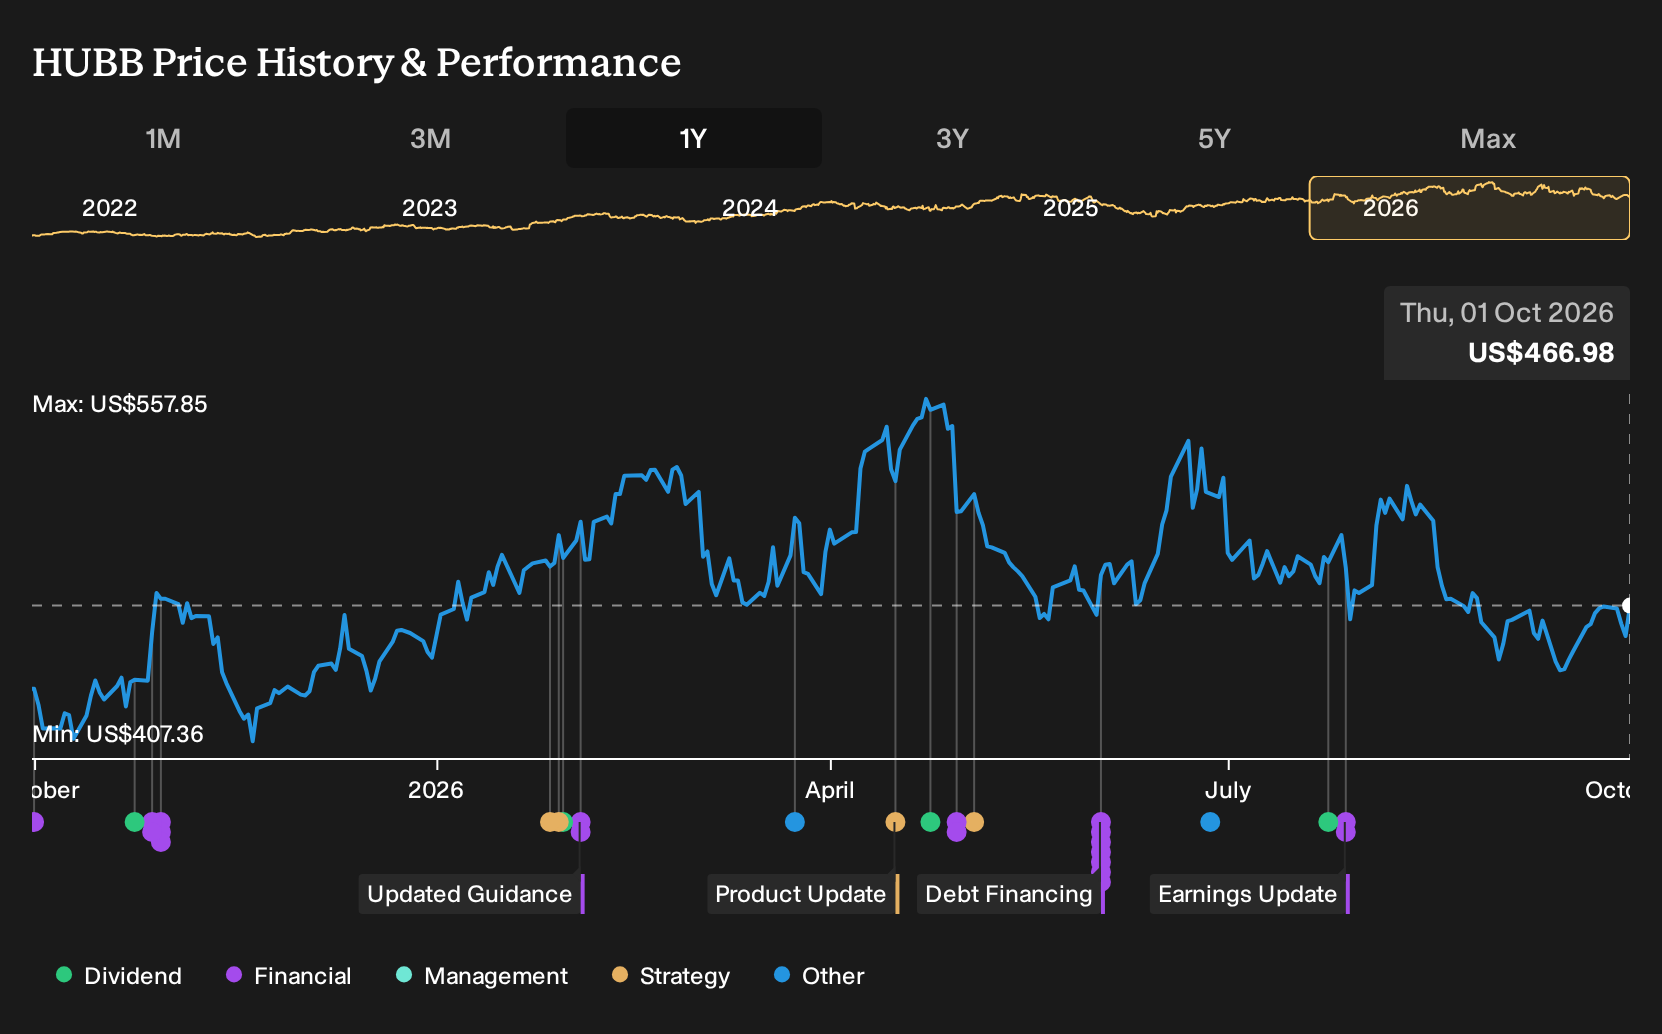
The NSI acquisition, closed in June 2026 for about US$3.0b, is the announcement that ties closest to this cash flow story. Hubbell is now working to extract 2% to 3% revenue synergies and 3% to 5% cost synergies over three years, with the deal expected to add to adjusted EPS in 2026 and 2027 if execution stays on track.
For you as a shareholder, the NSI deal amplifies both the catalyst and the risk. Successful integration would support the case that Hubbell can layer NSI’s portfolio onto rising grid and data center demand while using its improving free cash flow margin to handle higher interest costs. Slower synergy capture or integration hiccups would make that higher leverage more uncomfortable.
Hubbell's narrative projects US$8.6b revenue and US$1.3b earnings by 2029. This rests on analysts assuming 11.5% yearly revenue growth and earnings rising from US$900.6m today to US$1.3b, an increase of roughly US$399m.
Uncover why Hubbell's fair value indicates a 21% potential upside to its current price, which could narrow quickly.
Exploring Other Perspectives
One alternative angle on Hubbell focuses less on leverage risk and more on how bullish analysts framed the NSI acquisition as a potential earnings engine. Before this news, the most optimistic group expected revenue to reach about US$9.0b and earnings of roughly US$1.3b by 2029. Those pre news forecasts could shift meaningfully, so treat them as moving pieces rather than fixed truths.
Explore 3 other Hubbell fair value estimates, including one that suggests potential upside of up to 35% from the current price!
Form Your Own Verdict
Disagree with existing narratives? Extraordinary investment returns rarely come from following the herd, so go with your instincts.
- A great starting point for your Hubbell research is our analysis highlighting 4 key rewards and 1 important warning sign that could impact your investment decision.
- See our latest analysis for Hubbell. The report includes a comprehensive fundamental analysis summarized in a single visual, the Snowflake, making it easy to evaluate Hubbell's overall financial health at a glance.
Looking For More Investment Ideas Beyond Hubbell?
If the Hubbell story has sharpened your focus on cash generation, balance sheets and long term potential, you can use that same lens across the wider market with the Simply Wall St Screener. Mix and match different filters, then pressure test your own thesis instead of just following consensus.
- For investors looking for mispriced quality, you can start by scanning our 28 high quality undervalued stocks that combines solid financial profiles with attractive pricing signals.
- If income is your priority, you can filter for resilient payers using the 7 dividend fortresses to narrow in on higher yielding stocks.
- When capital preservation is near the top of your checklist, you can build a shortlist from the 31 resilient stocks with low risk scores that keeps overall risk scores in a more conservative range.
This article by Simply Wall St is general in nature. We provide commentary based on historical data and analyst forecasts only using an unbiased methodology and our articles are not intended to be financial advice. It does not constitute a recommendation to buy or sell any stock, and does not take account of your objectives, or your financial situation. We aim to bring you long-term focused analysis driven by fundamental data. Note that our analysis may not factor in the latest price-sensitive company announcements or qualitative material. Simply Wall St has no position in any stocks mentioned.
Have feedback on this article? Concerned about the content? Get in touch with us directly. Alternatively, email editorial-team@simplywallst.com