
MFF Capital Investments (ASX:MFF), What Is Behind The Fresh Attention?
Dividend update and asset values put MFF Capital Investments in focus
MFF Capital Investments (ASX:MFF) has drawn investor attention after updating its pre tax and post tax net tangible asset per share figures and confirming a fully franked final dividend along with an intended higher interim payout.
MFF Capital Investments is trading at A$5.40, with a 1-day share price return of 0.93% and a 90-day share price gain of 3.65%. The 1-year total shareholder return of 16.10% and 3-year total shareholder return of just over 2x hint at momentum that recent NTA and dividend news may be helping to reinforce.
Spot similar yield and valuation stories by scanning our hand picked 3 dividend fortresses that pair income potential with balance sheet strength.MFF Capital Investments appears to be a disciplined, income-friendly vehicle, but the stronger the portfolio story sounds after this NTA and dividend update, the sharper the real question becomes: Are you paying a fair price for it today?
Price-to-earnings of 20.1x for MFF Capital Investments: Is it justified?
MFF Capital Investments is trading on a P/E of 20.1x, which sits above both its direct peers and the wider Australian Capital Markets group. This means the A$5.40 share price reflects relatively stronger expectations than many rivals.
The P/E ratio compares what investors pay today for each dollar of current earnings. For an investment firm like MFF Capital Investments, it often reflects how the market views the quality and consistency of its profit stream rather than just one year of performance.
Here the picture is mixed. The business has grown earnings by 22.2% per year over the past 5 years, yet the most recent year showed a sharp decline in profit of 63.1% and a Return on Equity of 6.3% that sits well below the 20% benchmark used in the checks above. That combination suggests the current multiple is building in a fair amount of confidence that the weaker recent year is not the new normal.
Compared with the Australian Capital Markets industry average P/E of 18.9x and a peer average of 15.8x, MFF Capital Investments trades on a clearly richer valuation. The data provided does not give a fair ratio anchor for where the P/E could settle, so the current premium rests mainly on the market’s judgement that the long run track record and portfolio approach justify paying more than for the typical capital markets stock.
See what the numbers say about this price — find out in our valuation breakdown.
Result: Price-to-earnings of 20.1x (OVERVALUED).
Still, if portfolio earnings stay weaker or sentiment around MFF Capital Investments' investment style cools, that premium P/E could unwind faster than expected.
Find out about the key risks to this MFF Capital Investments narrative.
Another view on MFF Capital Investments' value
The P/E work paints MFF Capital Investments as expensive, yet the SWS DCF model points in the opposite direction. With the shares at A$5.40 and an estimated future cash flow value of A$10.92, that framework suggests the stock trades at a steep discount instead of a premium.
For anyone weighing these two stories, the practical question is simple. Is the earnings multiple sending a sharper warning about recent profit volatility, or is the cash flow model capturing something the headline P/E is missing?
Look into how the SWS DCF model arrives at its fair value.
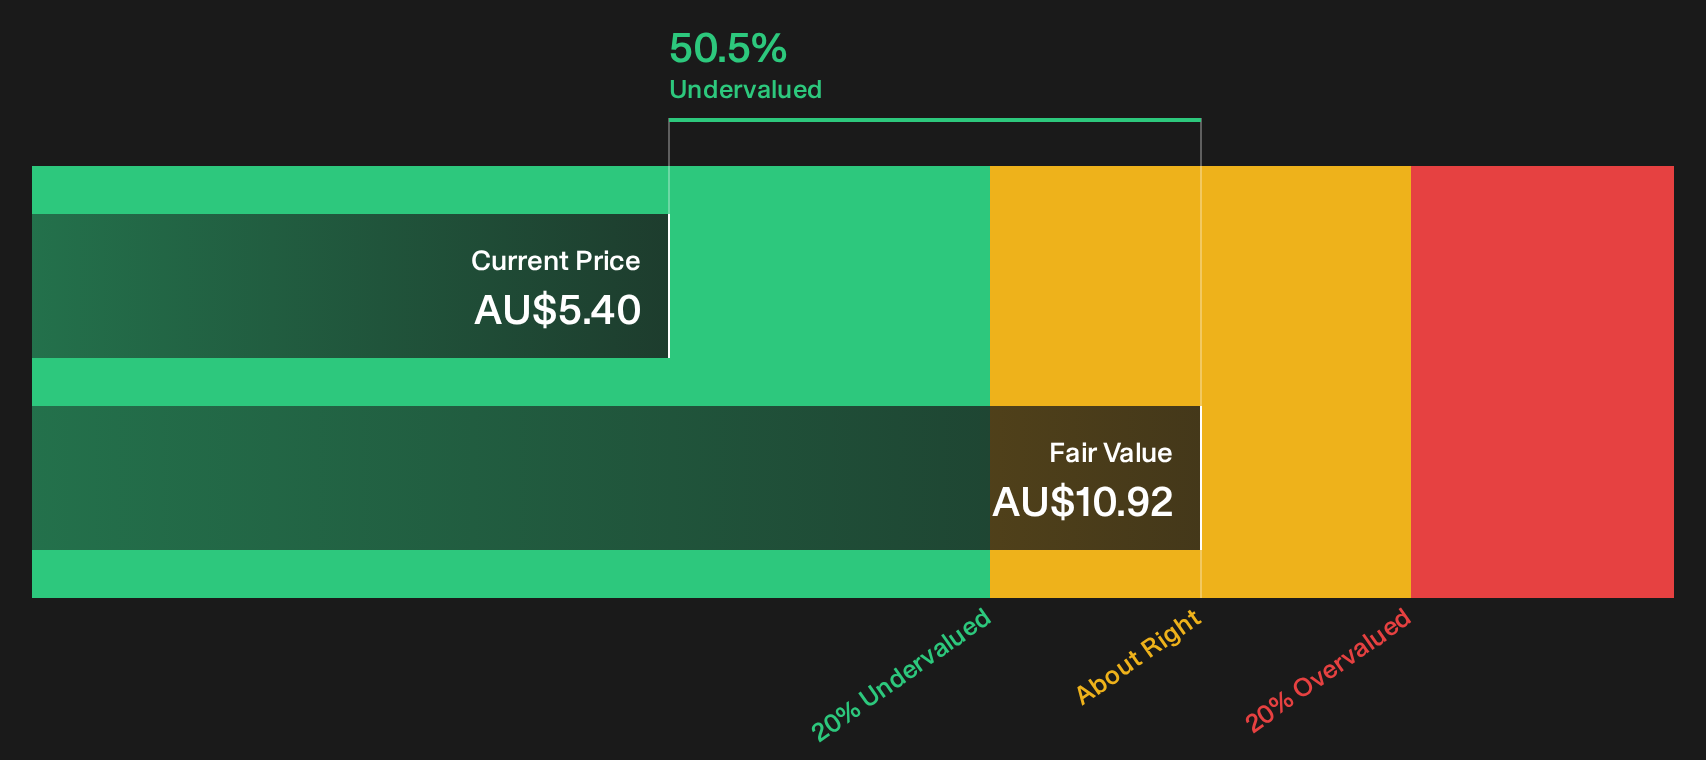
Simply Wall St performs a discounted cash flow (DCF) on every stock in the world every day (check out MFF Capital Investments for example). We show the entire calculation in full. You can track the result in your watchlist or portfolio and be alerted when this changes, or use our stock screener to discover 5 high quality undervalued stocks. If you save a screener we even alert you when new companies match - so you never miss a potential opportunity.
Next Steps
So with MFF Capital Investments pulling investors in for both its perceived risks and potential rewards, the real edge comes from doing your own homework quickly and forming a clear stance based on the 1 key reward and 1 important warning sign
Looking for more investment ideas beyond MFF Capital Investments?
If MFF Capital Investments has sharpened your focus on price and quality, do not stop here. Broader opportunities sit in plain sight for investors who keep searching.
- Target resilient cash generators by reviewing our 5 high quality undervalued stocks that combine quality fundamentals with prices that still look restrained.
- Strengthen capital protection by scanning the 7 resilient stocks with low risk scores that aim to keep balance sheets and risk scores front and centre.
- Unearth tomorrow's quiet overachievers by working through the 15 high quality undiscovered gems before other investors start paying attention.
This article by Simply Wall St is general in nature. We provide commentary based on historical data and analyst forecasts only using an unbiased methodology and our articles are not intended to be financial advice. It does not constitute a recommendation to buy or sell any stock, and does not take account of your objectives, or your financial situation. We aim to bring you long-term focused analysis driven by fundamental data. Note that our analysis may not factor in the latest price-sensitive company announcements or qualitative material. Simply Wall St has no position in any stocks mentioned.
Have feedback on this article? Concerned about the content? Get in touch with us directly. Alternatively, email editorial-team@simplywallst.com