
YONEX (TSE:7906) Could Be 44% Undervalued On Recent Share Price Weakness
YONEX (TSE:7906) drew fresh attention after a recent price move that left the shares down about 10% over the past month, prompting investors to reassess the sporting equipment manufacturer’s long term record.
That shorter term weakness fits into a tougher year for YONEX, with the share price return down 31.11% year to date and the 1 year total shareholder return falling 38.71%. However, 3 and 5 year total shareholder returns of 51.74% and 223.67% still point to strong longer run momentum, suggesting that recent selling pressure has cooled this trend rather than reversed it.
Capitalize on the reset in YONEX by comparing it with a curated 75 high quality undiscovered gems that combine solid track records with shares the market may be overlooking.The slide in YONEX now forces a basic question. Are investors reacting to cracks in the underlying business, or has sentiment simply swung too far ahead of what the valuation suggests?
Preferred P/E of 14.7x on YONEX: Is it justified?
On simple valuation terms, YONEX trades on a P/E of 14.7x, which sits below both the JP Leisure industry average of 16.2x and the peer group at 17.1x. That gap suggests the current ¥2,318 share price embeds more modest expectations than the broader sector despite the firm being assessed as good value relative to its own estimated fair metrics.
The P/E ratio compares the market price of each share with the earnings attributed to that share. It effectively shows how much investors are paying for each unit of profit. For a branded sporting equipment producer like YONEX, where earnings can be influenced by product cycles and demand for badminton, tennis, golf and other gear, this multiple becomes a shorthand for how much confidence the market has in the durability of those profits.
Here, the 14.7x P/E is framed as attractive compared to both direct peers and the wider leisure cohort. It is also judged reasonable versus an estimated fair P/E of 15.1x. That combination points to a market that is pricing YONEX with a discount relative to similar businesses, while still close to the level that regression based fair value work suggests the multiple could gravitate toward over time.
Explore the SWS fair ratio for YONEX.
Result: Price-to-earnings of 14.7x (UNDERVALUED)
Still, the recent 1 year total shareholder return decline of 38.71% and exposure to discretionary sports spending leave YONEX vulnerable if consumer demand or competition shifts further.
Find out about the key risks to this YONEX narrative.
Another View on YONEX using cash flows
The P/E discussion presents YONEX as modestly cheap, and the SWS DCF model adds another perspective. At ¥2,318 the shares are assessed as trading about 44% below an estimated fair value of ¥4,119.29. If that gap persists, which lens should carry more weight in your process?
Look into how the SWS DCF model arrives at its fair value.
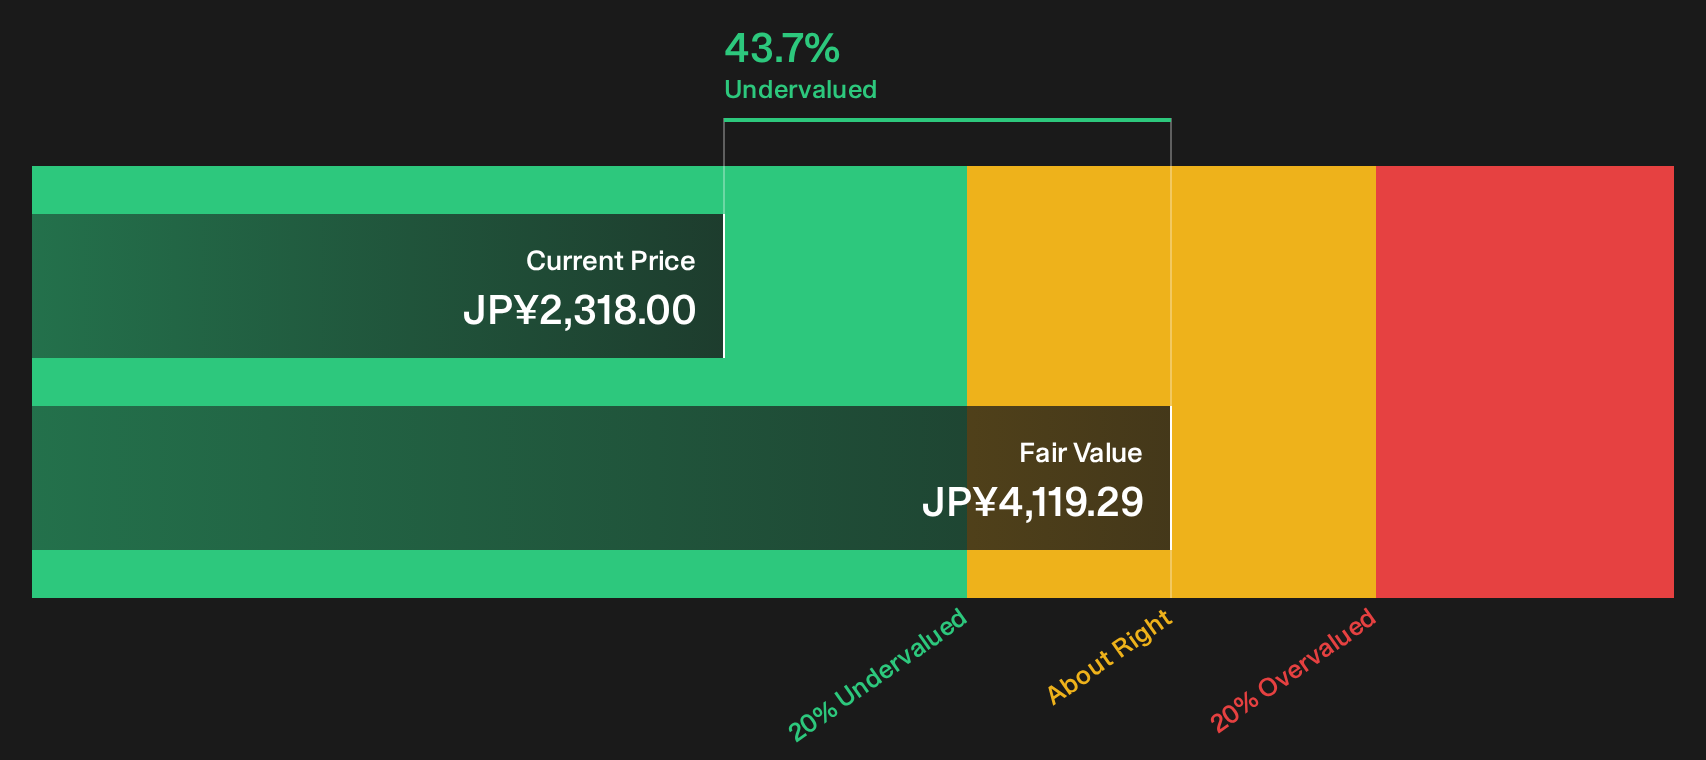
Simply Wall St performs a discounted cash flow (DCF) on every stock in the world every day (check out YONEX for example). We show the entire calculation in full. You can track the result in your watchlist or portfolio and be alerted when this changes, or use our stock screener to discover 18 high quality undervalued stocks. If you save a screener we even alert you when new companies match - so you never miss a potential opportunity.
Next Steps
If this mix of setbacks and potential rewards around YONEX feels finely balanced, act promptly, review the numbers yourself and weigh the 4 key rewards
Looking for more investment ideas beyond YONEX?
Fresh opportunities rarely wait around. If YONEX is on your radar, broaden your watchlist now and give yourself more choices before the next move arrives.
- Target resilient value by reviewing companies that combine reasonable pricing with quality fundamentals via the 18 high quality undervalued stocks.
- Strengthen your income stream by scanning for higher yielding payers that still look defensible using the 24 dividend fortresses.
- Prioritize staying power by focusing on financially robust businesses through the list of solid balance sheet and fundamentals (23 results).
This article by Simply Wall St is general in nature. We provide commentary based on historical data and analyst forecasts only using an unbiased methodology and our articles are not intended to be financial advice. It does not constitute a recommendation to buy or sell any stock, and does not take account of your objectives, or your financial situation. We aim to bring you long-term focused analysis driven by fundamental data. Note that our analysis may not factor in the latest price-sensitive company announcements or qualitative material. Simply Wall St has no position in any stocks mentioned.
Have feedback on this article? Concerned about the content? Get in touch with us directly. Alternatively, email editorial-team@simplywallst.com