
ICL Group (ICL) Modernizes EHS Systems, Is The Valuation Gap A Warning Or An Opportunity?
ICL Group (ICL) has overhauled its Environmental, Health, and Safety processes by adopting ERM’s Enablon platform, replacing older tools with a single system that centralizes data, reporting, and compliance workflows.
Recent trading suggests mixed conviction around ICL Group, with a 1-day share price return of 1.41% but a 30-day share price decline of 13.70% and a year-to-date share price return down 12.95%. The 1-year total shareholder return is down 16.90%, pointing to fading momentum despite the EHS upgrade story.
Scan for other materials stocks that are already turning operational upgrades into stronger share price trends with a curated set of 31 resilient stocks with low risk scores.
ICL Group now trades around US$5 after a weak year, yet sits at a double digit discount to both analyst targets and some intrinsic estimates. Does that gap reflect risk, or mispricing that valuation work can clarify?
ICL Group valuation gap: what the P/E is really pricing in
ICL Group closed at $5.04, yet the shares are trading at a richer P/E than many peers even after a weak return profile. This raises a basic question for investors: Is the current price simply reflecting the recent earnings pressure, or is the market assigning a premium that the underlying results do not clearly support?
The preferred yardstick here is the P/E ratio. For ICL Group, that multiple sits at 21.3x based on current figures. Investors often use this as a shorthand for how much they are paying for each dollar of earnings. In materials and chemicals, that metric tends to reflect expectations about pricing power, volume resilience, and the stability of profit margins through cycles rather than just one year of profit.
ICL Group carries a P/E of 21.3x, while its peer average sits at 15.7x and the wider US Chemicals industry is at 21.1x. At the same time, earnings have declined by 28% per year over the past 5 years and profit fell 16.9% over the last year, with current net profit margins of 4% below last year's 5.3%. That combination of weaker profit trends and a premium P/E suggests the shares may be trading at a relatively high valuation compared with both direct peers and the industry benchmark, even though some valuation work points to the stock trading 41.2% below an internal fair value estimate.
See what the numbers say about this price — find out in our valuation breakdown.
Result: Price-to-earnings of 21.3x (OVERVALUED)
Still, pressure on net income, a 4% margin, and multi year total returns that have moved lower could all challenge the case for ICL Group’s premium P/E.
Find out about the key risks to this ICL Group narrative.
Another view on ICL Group's value gap
A different lens on ICL Group points in the opposite direction to the premium P/E story. Using the SWS DCF model, the estimated future cash flow value sits at about $8.57 per share, while the stock trades at $5.04. That suggests the market could be underpricing the cash generation profile. The question is which signal should carry more weight for you?
Look into how the SWS DCF model arrives at its fair value.
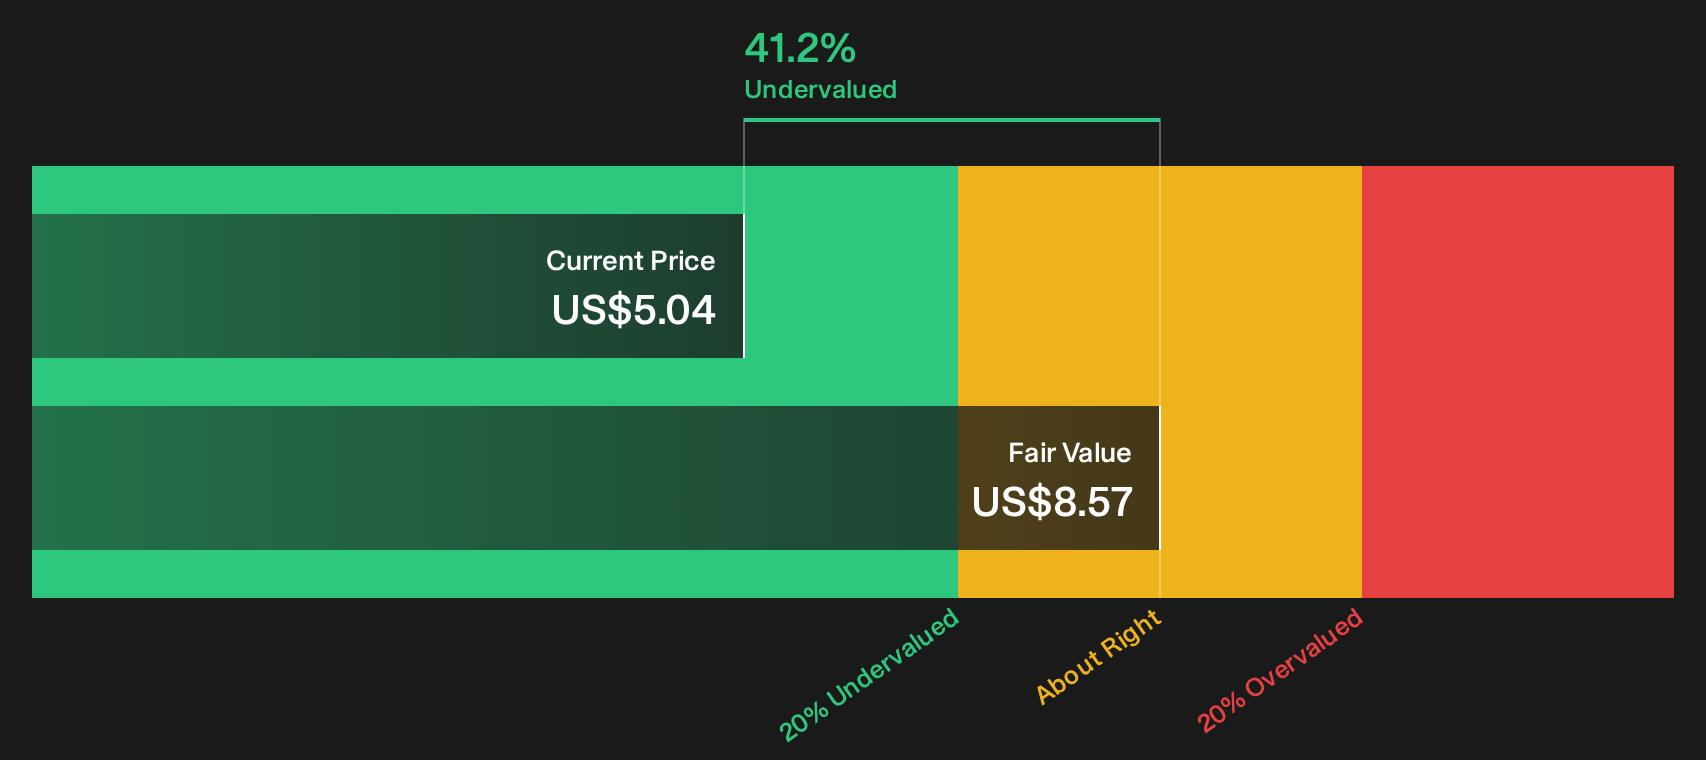
Simply Wall St performs a discounted cash flow (DCF) on every stock in the world every day (check out ICL Group for example). We show the entire calculation in full. You can track the result in your watchlist or portfolio and be alerted when this changes, or use our stock screener to discover 31 high quality undervalued stocks. If you save a screener we even alert you when new companies match - so you never miss a potential opportunity.
Next Steps
Mixed signals on ICL Group’s valuation and business trends can be confusing. Move quickly, review the key data points, and weigh both the upside and downside using our 1 key reward and 4 important warning signs
Looking for more investment ideas beyond ICL Group?
If ICL Group has you thinking harder about valuation and risk, do not stop there. Broader opportunity often shows up first in the wider watchlist you build.
- Target steadier returns by focusing on companies with durable finances through a curated list of solid balance sheet and fundamentals (26 results).
- Hunt for mispriced potential with a hand picked 19 high quality undiscovered gems that many investors are not watching yet.
- Prioritize capital preservation and calmer portfolio swings with a carefully filtered 31 resilient stocks with low risk scores.
This article by Simply Wall St is general in nature. We provide commentary based on historical data and analyst forecasts only using an unbiased methodology and our articles are not intended to be financial advice. It does not constitute a recommendation to buy or sell any stock, and does not take account of your objectives, or your financial situation. We aim to bring you long-term focused analysis driven by fundamental data. Note that our analysis may not factor in the latest price-sensitive company announcements or qualitative material. Simply Wall St has no position in any stocks mentioned.
Have feedback on this article? Concerned about the content? Get in touch with us directly. Alternatively, email editorial-team@simplywallst.com