
Why PC Connection (CNXN) Is Back In The Spotlight
PC Connection (CNXN) has quietly logged a 62.4% year-to-date return, far outpacing its past 3-month move of 27.5%. That gap is what now attracts closer attention.
Momentum in PC Connection now looks firmly upward, with a 14.1% 1 month share price return building on a 27.5% 3 month move and a 62.4% year to date share price gain, while a 1 year total shareholder return of 52.8% shows longer term holders also benefited.
Scan how PC Connection's run compares with other potential breakouts on our hand picked list of 19 high quality undiscovered gems.
PC Connection now trades near recent highs after that sharp climb, so the real puzzle is whether current pricing still leaves meaningful upside or already reflects the bulk of the story. This is where valuation work starts to matter.
Price to earnings of 24.3x for PC Connection: Is it justified?
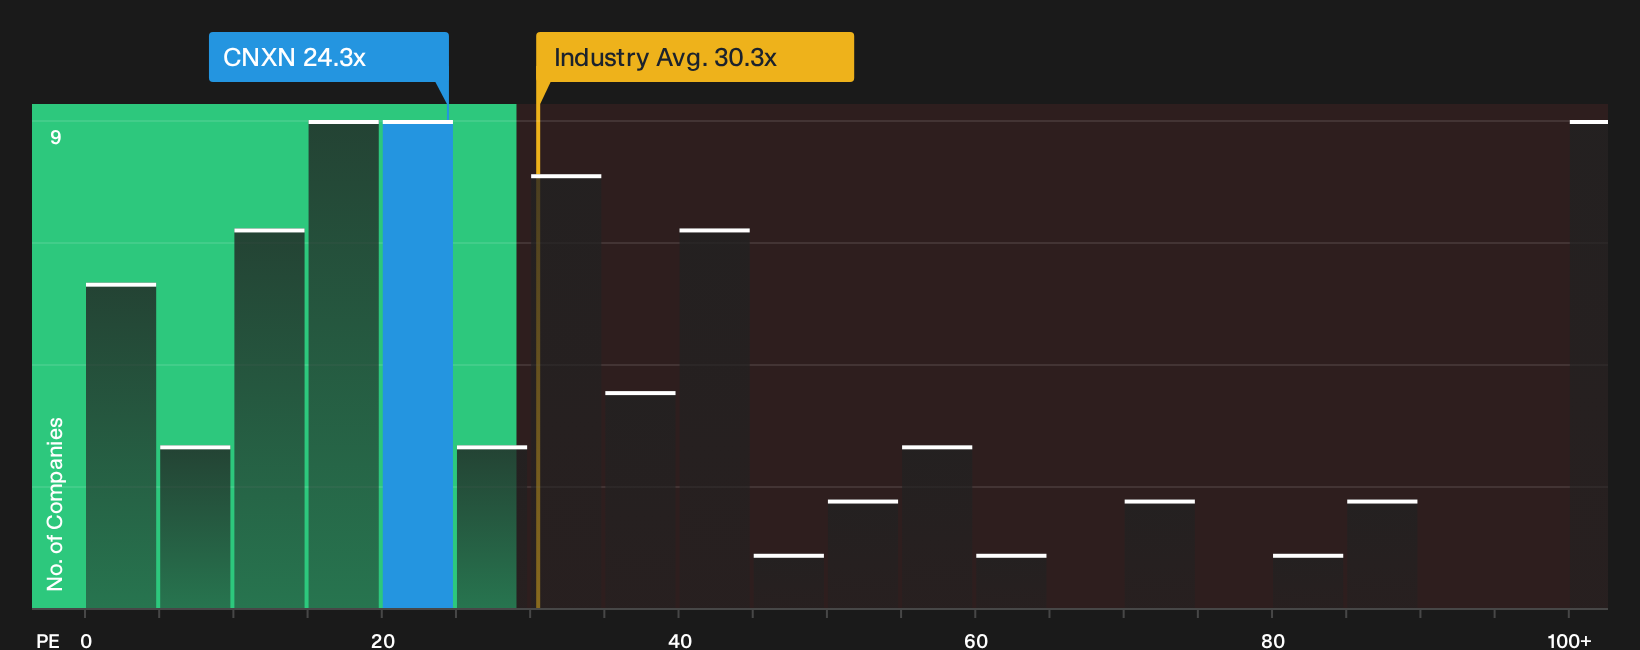
On valuation, PC Connection now carries a P/E of 24.3x against a last close of $92.38, which puts the stock on a richer earnings multiple than its own estimated fair level while still sitting below the broader US Electronic industry.
The P/E ratio compares the share price to annual earnings per share and effectively shows how many dollars investors are willing to pay for each dollar of profit. For a reseller and IT solutions provider like PC Connection, this metric matters because earnings quality and consistency often weigh more heavily than sheer top line expansion.
According to the SWS checks, that 24.3x P/E is described as expensive when lined up against an estimated fair P/E of 20.1x. This hints at the market attaching a premium over what the fair ratio model suggests could be a more grounded level. The same 24.3x P/E is also flagged as expensive versus a peer average of 22.5x, which again points to investors paying up relative to similar companies on this measure.
Against the broader US Electronic industry average P/E of 30.1x, though, PC Connection is described as good value. This indicates a clear discount versus the wider sector even if it trades above both its fair P/E and closer peer group. That mix of a premium to peers but a discount to industry and fair ratio paints a picture of a stock where the market is already pricing in solid earnings quality, with less room for error if profit growth or margins soften from here.
Explore the SWS fair ratio for PC Connection.
Result: Price-to-earnings of 24.3x (OVERVALUED).
Still, PC Connection faces clear pressure points if enterprise and public sector tech budgets pause, or if peers narrow that current P/E premium faster than expected.
Find out about the key risks to this PC Connection narrative.
Another view on PC Connection's value
The first check said PC Connection looks expensive on a 24.3x P/E, both against its own fair ratio of 20.1x and against peers at 22.5x. Yet the same P/E is described as good value versus the broader US Electronic industry on 30.1x. This leaves you asking whether the real risk sits in the stock or in the sector benchmark.
See what the numbers say about this price — find out in our valuation breakdown.
Simply Wall St performs a discounted cash flow (DCF) on every stock in the world every day (check out PC Connection for example). We show the entire calculation in full. You can track the result in your watchlist or portfolio and be alerted when this changes, or use our stock screener to discover 31 high quality undervalued stocks. If you save a screener we even alert you when new companies match - so you never miss a potential opportunity.
Next Steps
If sentiment around PC Connection now feels finely balanced between optimism and caution, consider acting promptly, reviewing the numbers independently, and then weighing the 3 key rewards and 1 important warning sign.
Looking for more PC Connection sized opportunities?
Do not stop with PC Connection. Use the Simply Wall Street Screener to scan wider, compare valuations fast, and surface ideas that might better fit your portfolio.
- Target potential mispricing by reviewing companies screened for quality and value on the 31 high quality undervalued stocks.
- Prioritise resilience by checking out the 31 resilient stocks with low risk scores and focus on businesses with lower overall risk scores.
- Strengthen your watchlist by searching the list of solid balance sheet and fundamentals (26 results) and focus on companies with sturdier financial foundations.
This article by Simply Wall St is general in nature. We provide commentary based on historical data and analyst forecasts only using an unbiased methodology and our articles are not intended to be financial advice. It does not constitute a recommendation to buy or sell any stock, and does not take account of your objectives, or your financial situation. We aim to bring you long-term focused analysis driven by fundamental data. Note that our analysis may not factor in the latest price-sensitive company announcements or qualitative material. Simply Wall St has no position in any stocks mentioned.
Have feedback on this article? Concerned about the content? Get in touch with us directly. Alternatively, email editorial-team@simplywallst.com