
CorVel (CRVL) On Its CareMC Launch And Whether The Valuation Still Fits
What CorVel’s CareMC Accelerator Launch Means For Investors
CorVel (CRVL) has rolled out its CareMC Accelerator for Guidewire ClaimCenter, tying managed care tools directly into claims workflows through secure single sign on, automated data transfer, and real time status updates.
Against this product launch backdrop, CorVel’s share price has shown building momentum, with a 30 day share price return of 7.22% and a 90 day share price return of 17.66%, while the 1 year total shareholder return of 2.22% signals more muted, longer term gains.
Compare CorVel’s CareMC rollout with other health focused tech plays by scanning the hand picked 35 healthcare AI stocks that are wiring software deeper into medical and claims workflows.
CorVel’s recent climb could reflect growing conviction in its managed care platform, or it could simply be sentiment chasing a headline. The valuation work now has to separate product story from price.
Preferred P/E of 33.1x for CorVel: Is It Justified?
Valuation on CorVel today hinges on a P/E of 33.1x at a last close of $75.47, which lines up below its peer group but well above the broader US Healthcare sector.
The P/E ratio compares the current share price with earnings per share and helps you see how much investors are willing to pay for each dollar of profit. For a healthcare services and technology hybrid like CorVel, this matters because the equity story leans heavily on earnings quality, return on equity and the potential for its software driven platform to keep supporting profitability.
Here, the market is attaching a lower P/E than the 39.1x peer average, which points to a discount against similar businesses using earnings based yardsticks. At the same time, the stock trades on a richer multiple than the 24.1x US Healthcare industry level, which suggests investors currently accept a premium relative to the wider sector while still pricing CorVel below closer peers.
Result: Price-to-Earnings of 33.1x (ABOUT RIGHT)
See what the numbers say about this price — find out in our valuation breakdown.
Still, CorVel’s thesis can be knocked off course if CareMC adoption inside ClaimCenter underwhelms, or if managed care fee pressure compresses profitability expectations.
Find out about the key risks to this CorVel narrative.
Another View On CorVel’s Valuation
The P/E argument for CorVel leans toward “about right,” yet the SWS DCF model points in a different direction. At a share price of $75.47 versus an estimated future cash flow value of $65.75, the stock screens as overvalued. Which signal do you trust when the story and the spreadsheet disagree?
Look into how the SWS DCF model arrives at its fair value.
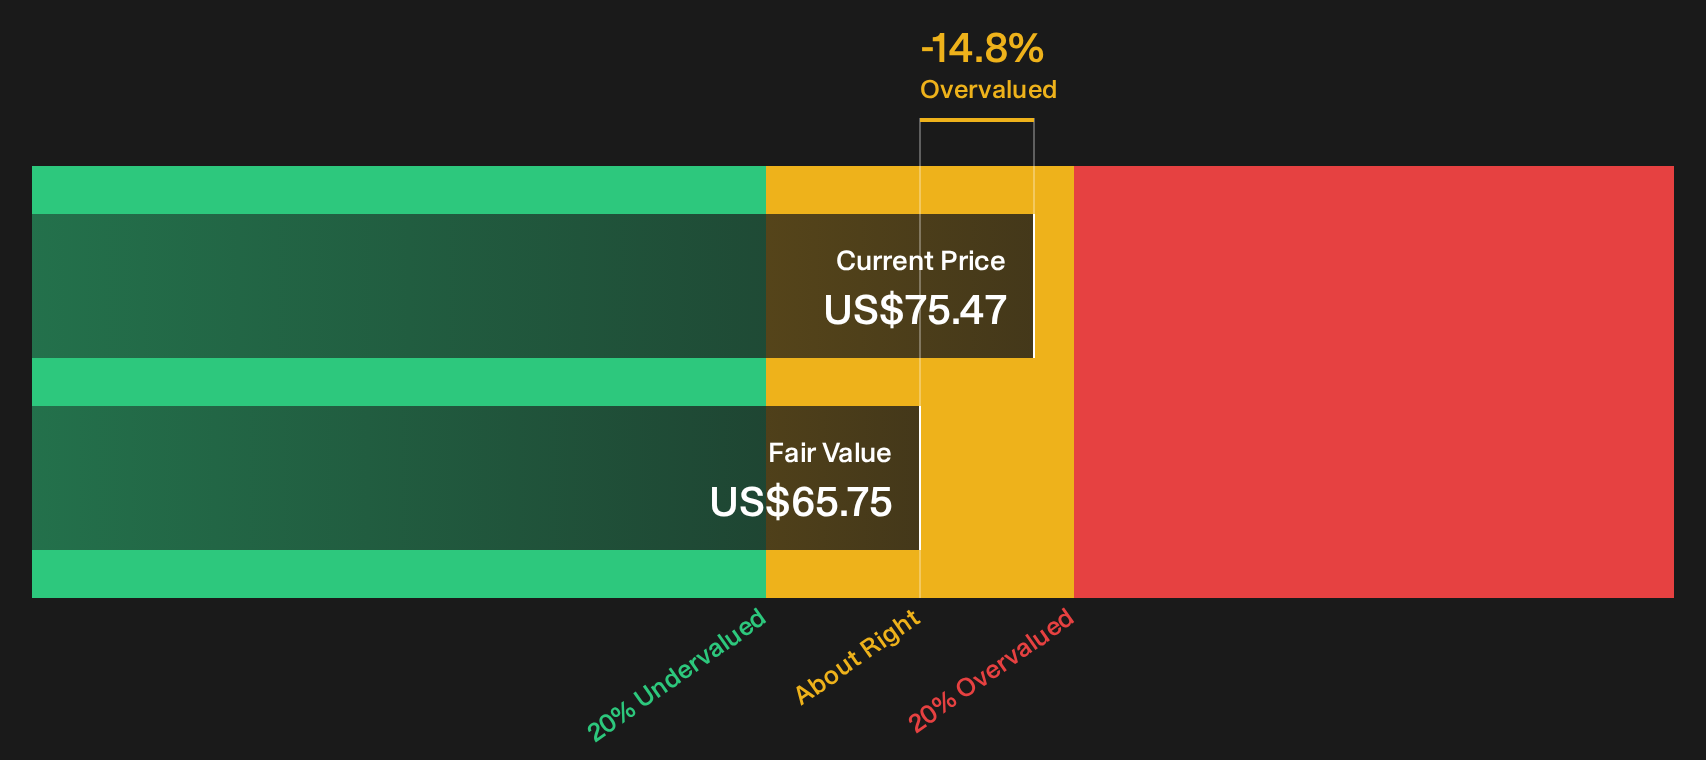
Simply Wall St performs a discounted cash flow (DCF) on every stock in the world every day (check out CorVel for example). We show the entire calculation in full. You can track the result in your watchlist or portfolio and be alerted when this changes, or use our stock screener to discover 31 high quality undervalued stocks. If you save a screener we even alert you when new companies match - so you never miss a potential opportunity.
Next Steps
Reading all of this on CorVel and still unsure how to feel about the risk reward trade off? Move quickly, review the data yourself, then weigh the 1 key reward and 1 important warning sign.
Looking for more CorVel sized investment ideas?
Still weighing up CorVel’s setup and next move? Do not stop here. Broaden your watchlist with fresh ideas that match the way you like to invest.
- Target companies that pair quality with a potential markdown by scanning the 31 high quality undervalued stocks that fit your valuation standards before others focus on them.
- Lock in cash flow from markets that reward patience by reviewing the 7 dividend fortresses that already offer substantial income potential.
- Prioritise resilience when conditions change by running through the 31 resilient stocks with low risk scores that score well on financial strength and downside protection.
This article by Simply Wall St is general in nature. We provide commentary based on historical data and analyst forecasts only using an unbiased methodology and our articles are not intended to be financial advice. It does not constitute a recommendation to buy or sell any stock, and does not take account of your objectives, or your financial situation. We aim to bring you long-term focused analysis driven by fundamental data. Note that our analysis may not factor in the latest price-sensitive company announcements or qualitative material. Simply Wall St has no position in any stocks mentioned.
Have feedback on this article? Concerned about the content? Get in touch with us directly. Alternatively, email editorial-team@simplywallst.com