
Will Higher Cash Flow Guidance Change South Bow Stock Narrative
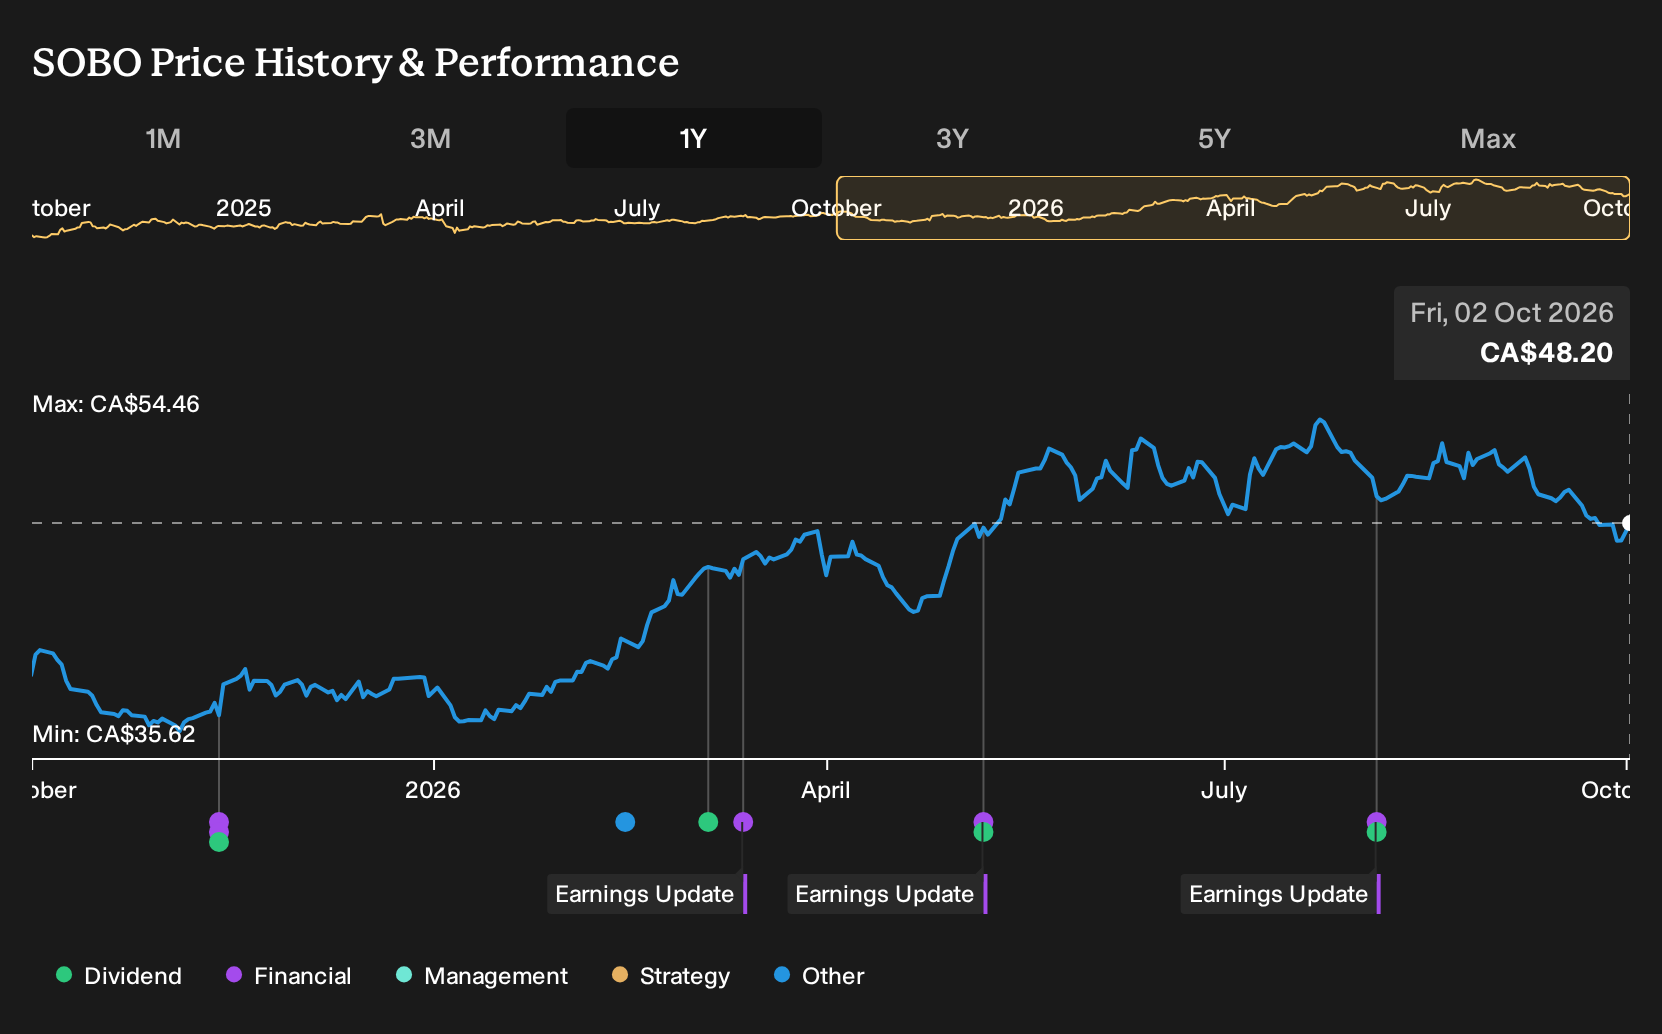
- South Bow Corp. reported quarterly distributable cash flow of US$175 million and raised its 2026 distributable cash flow guidance to about US$665 million, while maintaining a quarterly dividend of US$0.50 per share that currently yields about 6.02%.
- The update highlights how fee based revenue from the Keystone Pipeline System is underpinning South Bow's cash generation, even as elevated debt and interest costs continue to shape its financial flexibility.
- We will look at how South Bow's investment narrative evolves, as stronger distributable cash flow guidance reframes the balance between income and leverage.
Scan beyond South Bow and line up other high-yield plays with fee based cash generation using our hand picked 1 dividend fortresses as a comparison set.
South Bow Investment Narrative Recap
For South Bow, the core belief is that a large, contracted pipeline system can keep throwing off steady, fee based cash even as conditions around it shift. The higher 2026 distributable cash flow guidance points to more room between that cash and the current dividend. The near term swing factor is how quickly Keystone volumes and marketing margins translate into actual cash generation.
The biggest risk right now remains the balance sheet. Debt and interest costs are still heavy, which could limit room to fund growth projects beyond Blackrod or to absorb weaker spot volumes if differentials stay tight. The latest update does not remove that risk; it just makes the income side look a bit sturdier.
The decision to lift 2026 distributable cash flow guidance to about US$665 million after a US$175 million quarter matters most here. That guidance effectively ties the investment story back to what Keystone and the intra Alberta assets are doing operationally, and how much of that fee based inflow reaches shareholders after capital spending and financing costs.
For you as an investor, that higher cash flow outlook sits alongside a 6.02% dividend yield and known pressure from interest payments that are not well covered by earnings. The announcement nudges the near term narrative toward income resilience, while the real catalysts still sit in areas like Blackrod ramp up, Keystone integrity work, and cost optimization to relieve some of the leverage strain over time.
What The South Bow Analyst Forecasts Really Assume
South Bow's earnings profile in the consensus models looks relatively flat. Analysts are working with current earnings of about US$460.0 million and expect that figure to be around US$458.8 million by 2029. This implies a small earnings decline of roughly US$1.2 million over that stretch rather than a step change up or down.
On the top line, those same forecasts build in revenue growth of 1.9% per year over the next three years, paired with some pressure on profitability, as margins in the models move from about 23.0% today to 21.6% by 2029. That combination gets analysts to an earnings consensus of US$458.8 million in 2029 and a revenue line of US$2.1b in that year. This in turn underpins the P/E assumptions in their valuation work.
To tie those building blocks together, the consensus view uses a P/E multiple of 20.2x on the 2029 earnings estimate, compared with about 16.1x on South Bow today, and applies a discount rate of roughly 6.7% to translate those future cash earnings back into a present value framework. That future multiple still sits slightly below the current P/E cited for the broader Canadian oil and gas peer group at 20.9x, which matters if you are comparing South Bow with other income oriented pipeline stocks.
South Bow's narrative projects US$2.1b revenue and US$458.8 million earnings by 2029. This requires 1.9% yearly revenue growth and a US$1.2 million earnings decline from US$460.0 million today.
Uncover why South Bow's fair value indicates a 6% potential upside to its current price before that gap starts to close.
Exploring Other Perspectives
Some of the most optimistic analysts on South Bow lean hard into Keystone as a catalyst. They were already modeling roughly US$2.2b of revenue and about US$453.3 million of earnings by 2029 on a richer 24.1x P/E, before this update. You can compare that upbeat view with the latest guidance and decide whether those expectations still feel reasonable.
Explore 3 other South Bow fair value estimates, including one that suggests as much as 179% potential increase from the current price!
Form Your Own Verdict
Don't just follow the ticker. Dig into the data and build a conviction that's truly your own.
- A great starting point for your South Bow research is our analysis highlighting 4 key rewards and 2 important warning signs that could impact your investment decision.
- See our latest analysis for South Bow. The report includes a comprehensive fundamental analysis summarized in a single visual, the Snowflake, making it easy to evaluate South Bow's overall financial health at a glance.
Looking For More Investment Ideas Beyond South Bow?
If the South Bow story has you thinking about income, balance sheets, and long term cash generation, it can help to line it up against other opportunities using the Simply Wall St Screener. Use these ready made filters to quickly build a watchlist that fits the way you like to invest.
- For investors who want income backed by resilient finances, compare South Bow with a list of solid balance sheet and fundamentals (7 results) that can help support dividend and reinvestment decisions.
- If you prefer to focus on resilient businesses with fewer red flags, look across 8 resilient stocks with low risk scores that may offer a smoother ride when conditions change.
- Those hunting for under followed opportunities can review 9 high quality undiscovered gems that pair strong fundamentals with less crowding from other investors.
This article by Simply Wall St is general in nature. We provide commentary based on historical data and analyst forecasts only using an unbiased methodology and our articles are not intended to be financial advice. It does not constitute a recommendation to buy or sell any stock, and does not take account of your objectives, or your financial situation. We aim to bring you long-term focused analysis driven by fundamental data. Note that our analysis may not factor in the latest price-sensitive company announcements or qualitative material. Simply Wall St has no position in any stocks mentioned.
Have feedback on this article? Concerned about the content? Get in touch with us directly. Alternatively, email editorial-team@simplywallst.com