
TriNet Group (TNET) Faces A Valuation Split, Where Does Fair Value Sit?
TriNet Group (TNET) has been drawing fresh attention after recent trading left the stock at US$63.24, with performance mixed over different periods and raising new questions about how investors are valuing its HR services model.
Recent trading tells a mixed story for TriNet Group. Short term share price momentum has faded with the 1-month share price return down 6.1%. However, the 90-day share price return is up 14.5% and the 1-year total shareholder return is slightly negative, hinting that recent weakness comes after a stronger rebound from earlier declines.
Scan how TriNet Group compares with other HR and business services stocks by reviewing our curated list of list of solid balance sheet and fundamentals (26 results).
After a 14.5% climb over three months but a 3 year return that has declined more than 44%, TriNet Group now sits in a tricky middle ground. Does that balance of rebound and past damage still favour new buyers on valuation?
Most Popular Narrative: 26.5% Overvalued
Against a last close of $63.24, the most followed narrative pins TriNet Group's fair value at $50, pointing to a meaningful valuation gap that depends heavily on how its HR model holds up against structural industry shifts.
While industry consolidation should in theory reward scale players like TriNet with greater pricing power and improved margins, there is a risk that the inability to fully pass on rising healthcare and benefits costs to clients, especially in an environment of commoditizing services and increased price competition, may result in sustained gross margin compression and restrain adjusted EBITDA and free cash flow improvement in the coming years.
See why 1 investors see TriNet Group as 26% overvalued.
Result: Fair Value of $50 (OVERVALUED)
Still, shrinking worksite employee volumes and pressure from rising healthcare costs could unsettle TriNet Group's outlook if client attrition or margin strain deepens.
Find out about the key risks to this TriNet Group narrative.
Another View on TriNet Group’s Valuation
The bearish fair value narrative pegs TriNet Group at $50, which makes the stock look stretched against its current price. A different lens tells a very different story. The SWS DCF model estimates TriNet Group’s future cash flows support a value of $193.35, suggesting the shares trade well below that level. It raises a simple question: Which set of assumptions do you trust more?
Look into how the SWS DCF model arrives at its fair value.
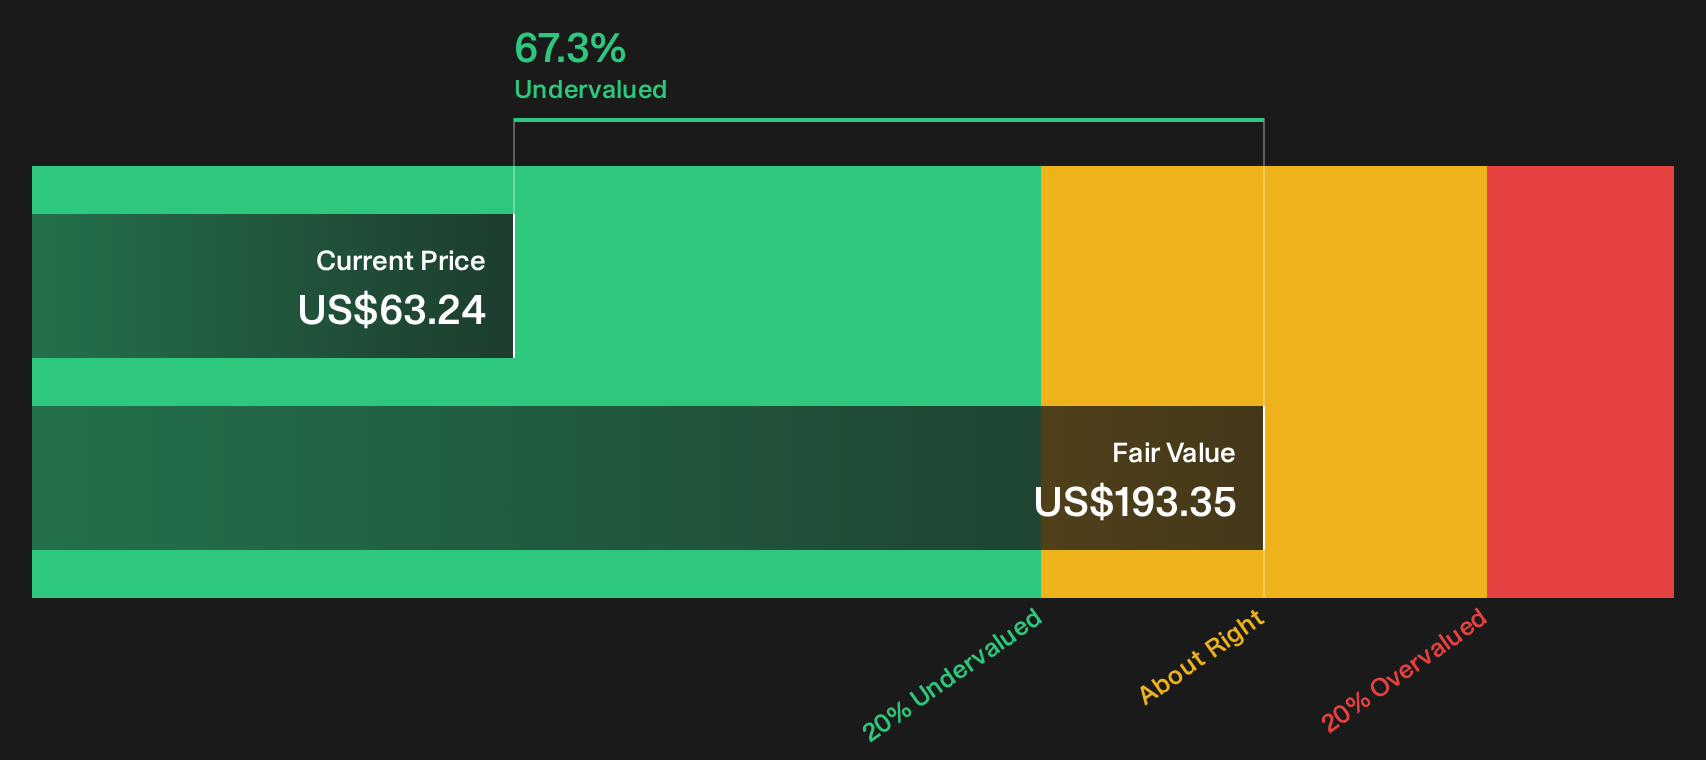
Simply Wall St performs a discounted cash flow (DCF) on every stock in the world every day (check out TriNet Group for example). We show the entire calculation in full. You can track the result in your watchlist or portfolio and be alerted when this changes, or use our stock screener to discover 31 high quality undervalued stocks. If you save a screener we even alert you when new companies match - so you never miss a potential opportunity.
Next Steps
If this mix of caution and optimism around TriNet Group feels unresolved, move quickly to review the underlying data and weigh both the 2 key rewards and 3 important warning signs.
Looking for more investment ideas beyond TriNet Group?
Do not stop your research with TriNet Group. Broaden your watchlist using focused stock ideas that match different risk levels, income goals, and value preferences.
- Target long term compounding potential with companies that screen as attractively priced relative to quality by reviewing our curated list of 31 high quality undervalued stocks.
- Lock in more predictable cash flow from your portfolio by scanning income opportunities across our hand picked universe of 7 dividend fortresses.
- Dial down portfolio stress and concentrate on stability by filtering for businesses that pass our resilience checks through the 31 resilient stocks with low risk scores.
This article by Simply Wall St is general in nature. We provide commentary based on historical data and analyst forecasts only using an unbiased methodology and our articles are not intended to be financial advice. It does not constitute a recommendation to buy or sell any stock, and does not take account of your objectives, or your financial situation. We aim to bring you long-term focused analysis driven by fundamental data. Note that our analysis may not factor in the latest price-sensitive company announcements or qualitative material. Simply Wall St has no position in any stocks mentioned.
Have feedback on this article? Concerned about the content? Get in touch with us directly. Alternatively, email editorial-team@simplywallst.com