
Missed IMAX’s 56% Run? What The Market Kept Getting Wrong
IMAX just posted a quarter where revenue and profit both rose, yet headlines fixated on a soft China box office and pressure from streaming and premium home setups. For IMAX shareholders, the return over the past year was 56.4%, including dividends. If you had been weighing those at-home threats against premium-theater enthusiasm back in October 2025, what in the record would have helped you judge whether this kind of payoff was even plausible?
If the move has made IMAX harder to judge, start where the gap is still open and scan 31 high quality undervalued stocks.
The Two IMAX Stories Investors Had To Weigh
The shares cost US$32.99 at the start of the period, and IMAX investors were effectively choosing between two very different but credible stories about what came next.
On the bullish side, the optimistic narrative put Fair Value at US$38. This price was implied by assumptions built on IMAX using immersive technology and Asia-Pacific demand to support recurring box office and installation income as its global network expanded.
The bearish view pointed to a Fair Value of US$18. This outlook leaned on the risk that better home setups and weaker cinema habits would cap audience growth and leave the business exposed to swings in blockbuster output.
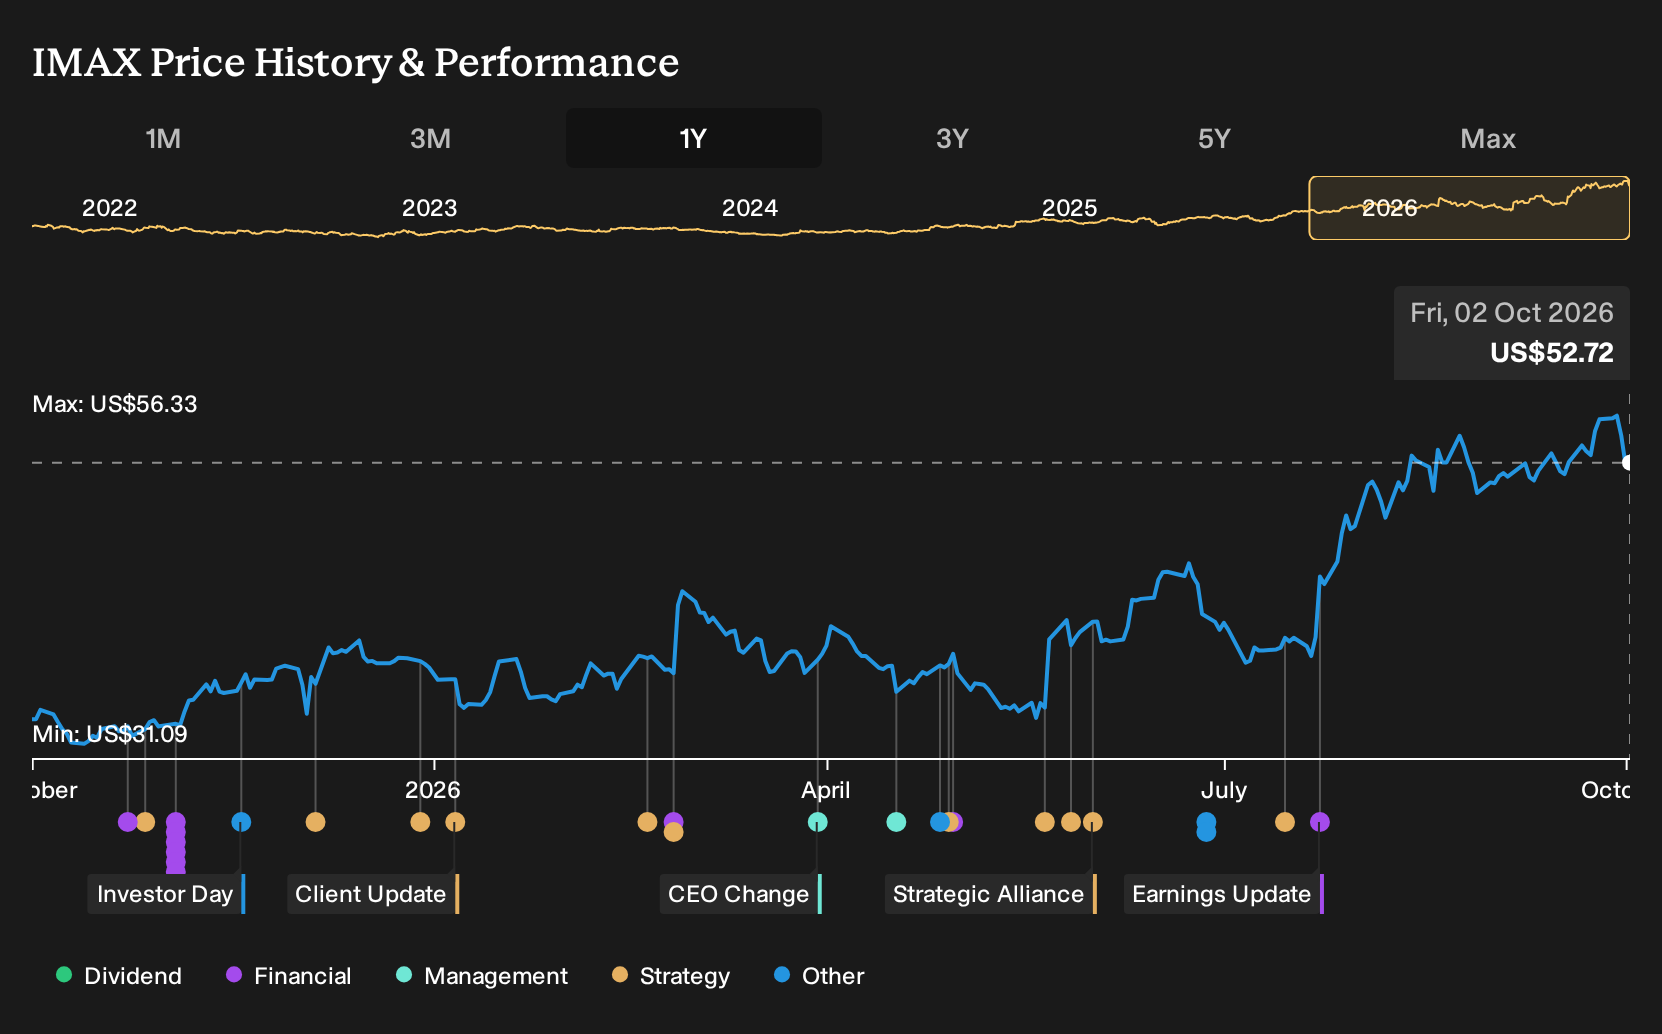
What The IMAX Evidence Actually Tested
The key development was IMAX lifting both revenue and net income between Q2 2025 and Q2 2026, with net margin rising from 12.3% to 15.0%. That outcome leaned toward the optimistic case that imagined stronger profitability from premium experiences, while still leaving open the bearish concern that results depend on a supportive release slate. Overall, the evidence supported the optimistic case.
The lesson is simple. When a fair value story hangs on better economics per screen, focus on margin movement more than headline box office or hype. For any cinema or live entertainment stock, track whether reported net margin is actually trending toward the level the original thesis required.
What IMAX's Current Price Already Assumes
IMAX now trades at US$52.72, and the selected Narrative’s Fair Value sits below that level. The view leans on record box office, broader content and technology upgrades, paired with concern that cinema habits and premium home setups could blunt long run theater demand.
A buyer here is effectively assuming IMAX can keep premium attendance, per screen economics and new formats growing from elevated levels. The question is how that assumption lines up with the Narrative’s focus on home entertainment narrowing IMAX’s experiential edge and on reliance on tentpole-heavy release calendars.
"Advancements in at-home entertainment and shifting viewer habits are diminishing IMAX's unique value proposition, threatening sustained audience growth and future revenue streams. Heavy reliance on blockbuster content, saturated developed markets, and growing competition from alternatives heighten revenue volatility and limit long-term organic growth opportunities."
That disagreement has a full argument behind it. → Uncover the lower Fair Value this Narrative argues for
Before The Next Story Makes Headlines
By the time a rally makes headlines, you are reading about returns someone else has already earned. Why not go straight to the source and look for your own contrarian opportunity? These three companies trade below our estimated value.
- Company 1 - 34% below our estimate - turns a backlog of technology-focused construction projects into installation and maintenance work.
- Company 2 - 37% below our estimate - converts subsea opportunity lists into accelerated tieback developments and extended service agreements.
- Company 3 - 23% below our estimate - sells GPU-based computing platforms used to run artificial intelligence workloads with integrated software.
That is three of the list. See the full list of 26 financially solid companies →
This article by Simply Wall St is general in nature. We provide commentary based on historical data and analyst forecasts only using an unbiased methodology and our articles are not intended to be financial advice. It does not constitute a recommendation to buy or sell any stock, and does not take account of your objectives, or your financial situation. We aim to bring you long-term focused analysis driven by fundamental data. Note that our analysis may not factor in the latest price-sensitive company announcements or qualitative material. Simply Wall St has no position in any stocks mentioned.
Have feedback on this article? Concerned about the content? Get in touch with us directly. Alternatively, email editorial-team@simplywallst.com