
Daikin IndustriesLtd (TSE:6367), What Is Behind The Fresh Attention?
Daikin Industries Ltd (TSE:6367) drew fresh attention after a recent price move left the share price around ¥20,585, inviting investors to reassess the air conditioning specialist’s longer term return profile.
Recent trading tells a mixed story for Daikin IndustriesLtd, with the share price easing around 1% over the past month and almost 20% over 90 days. However, a 20.04% 1 year total shareholder return points to earlier momentum that has since cooled as expectations and risk perceptions reset.
Scan for other industrials showing similar resets in expectations and risk by checking our hand-picked list of solid balance sheet and fundamentals (23 results) alongside Daikin Industries Ltd.
The question now is simple. After Daikin Industries Ltd’s pullback and reset in expectations, does the current valuation still skew the risk reward towards buyers, or has the easy upside already been taken?
Price-to-Earnings of 20.9x: Is it justified?
On earnings, the Daikin IndustriesLtd share price around ¥20,585 equates to a P/E of 20.9x, which screens as expensive against both its building peers and the broader Japanese industry.
The P/E ratio compares what investors are paying today for each unit of current earnings. For a diversified air conditioning and refrigeration group like Daikin IndustriesLtd, that figure often reflects how the market views the quality and resilience of its profit stream rather than just raw growth rates.
Here, the valuation picture is mixed. The stock trades on 20.9x earnings, which is higher than the JP Building industry average of 12.2x and above the 17x peer group average. Yet it is described as good value relative to an estimated fair P/E of 22.9x. This suggests the market is applying a lower multiple than that reference level and could, over time, move closer to that fair ratio if earnings quality and growth forecasts remain intact.
In plain terms, the market is assigning a meaningfully richer multiple than the sector, but still a discount to the estimated fair 22.9x level. That signals investors are paying up compared with peers, while the fair ratio implies scope for the valuation to drift higher rather than compress if the thesis holds.
Explore the SWS fair ratio for Daikin IndustriesLtd.
Result: Price-to-Earnings of 20.9x (OVERVALUED)
Still, Daikin Industries Ltd faces a reset risk if earnings momentum stalls or if investor focus shifts toward cheaper industrials after the recent three-year share price decline.
Find out about the key risks to this Daikin IndustriesLtd narrative.
Another View on Daikin Industries Ltd’s Value
The P/E points to Daikin IndustriesLtd being priced richly against peers, yet our DCF model presents a different perspective. With the shares around ¥20,585 and an estimated future cash flow value of roughly ¥26,256, the stock appears undervalued on this basis. Which signal do you rely on more?
Look into how the SWS DCF model arrives at its fair value.
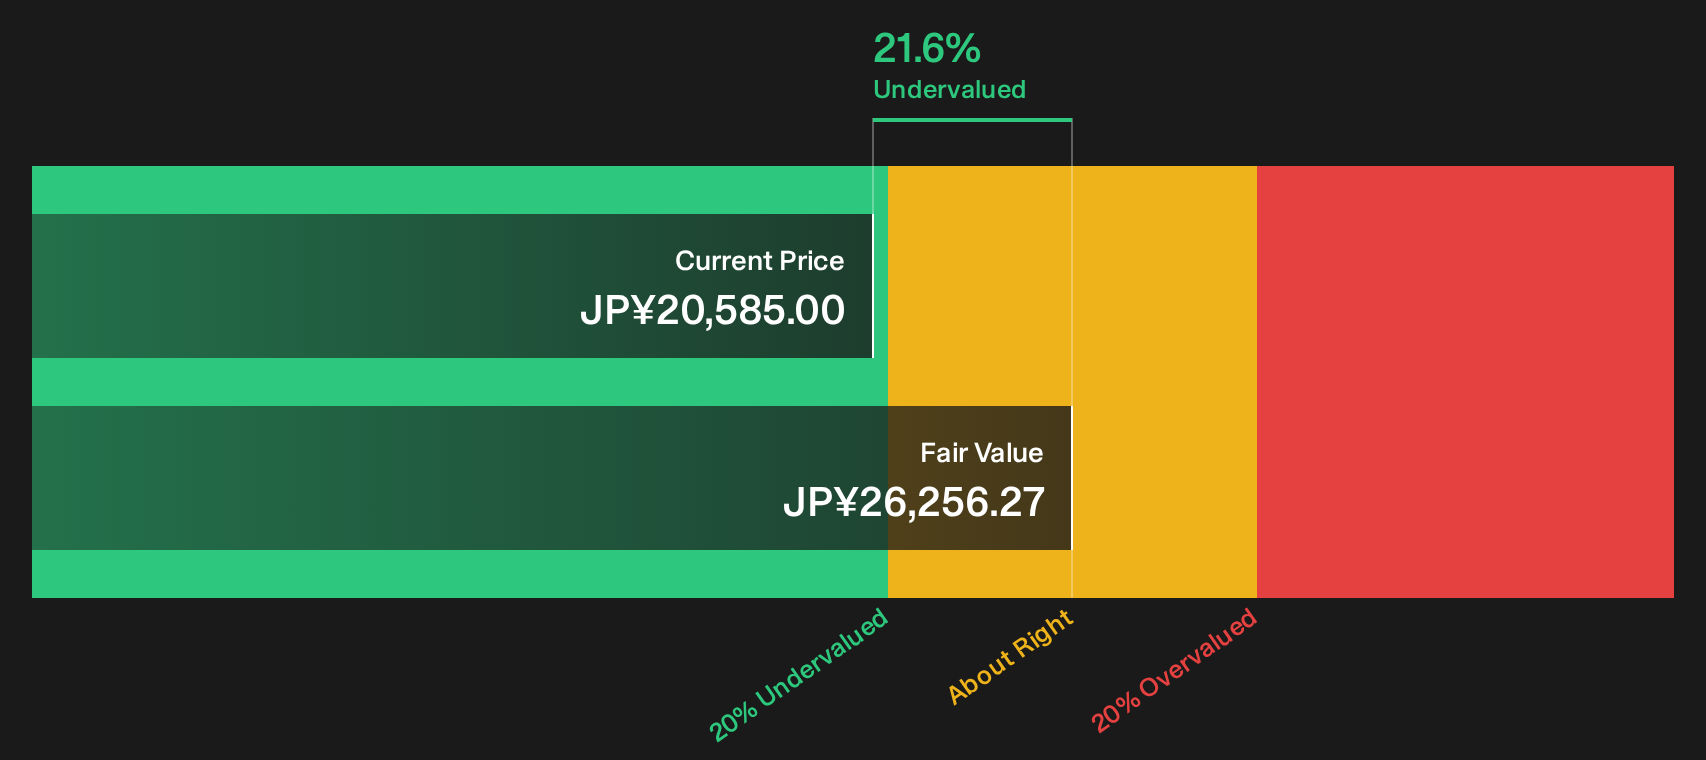
Simply Wall St performs a discounted cash flow (DCF) on every stock in the world every day (check out Daikin IndustriesLtd for example). We show the entire calculation in full. You can track the result in your watchlist or portfolio and be alerted when this changes, or use our stock screener to discover 17 high quality undervalued stocks. If you save a screener we even alert you when new companies match - so you never miss a potential opportunity.
Next Steps
Curious whether the tone of this Daikin Industries Ltd review feels too cautious or not cautious enough? Act quickly, pull up the underlying data, then stress test your own thesis against the 2 key rewards.
Looking for more ideas beyond Daikin Industries Ltd?
Do not stop at Daikin Industries Ltd. Broaden your watchlist with a few targeted screens that can surface opportunities you might otherwise miss.
- Target resilient balance sheets early by scanning the list of solid balance sheet and fundamentals (23 results) before capital rotates toward stronger financial profiles.
- Hunt for quality at a discount through the 17 high quality undervalued stocks and compare those candidates with Daikin Industries Ltd on your own terms.
- Build potential income now by reviewing the 24 dividend fortresses and see which payouts line up with your risk tolerance.
This article by Simply Wall St is general in nature. We provide commentary based on historical data and analyst forecasts only using an unbiased methodology and our articles are not intended to be financial advice. It does not constitute a recommendation to buy or sell any stock, and does not take account of your objectives, or your financial situation. We aim to bring you long-term focused analysis driven by fundamental data. Note that our analysis may not factor in the latest price-sensitive company announcements or qualitative material. Simply Wall St has no position in any stocks mentioned.
Have feedback on this article? Concerned about the content? Get in touch with us directly. Alternatively, email editorial-team@simplywallst.com