
CECO Environmental (CECO) Shares Moved, So What Is Driving Attention Now?
CECO Environmental (CECO) has drawn attention after its shares closed at US$73.66, with the move coming alongside a year to date total return of 23.20% and a 1 year return of 46.50%.
Recent trading has been mixed, with a 1-day share price return of 2.49% and a 30-day share price return of 3.59%, set against a 90-day share price move that declined 10.33%. At the same time, CECO Environmental’s multi year total shareholder return, including dividends, has been very large over five years, suggesting momentum has cooled in the short term even as longer term holders have seen substantial gains.
Scan beyond CECO Environmental’s surge and size up other industrials with strong price action and fundamentals using our curated list of list of solid balance sheet and fundamentals (26 results).
CECO Environmental has surged over several years, yet its recent 90 day pullback gives anyone on the sidelines a fresh decision. Is this the moment to step in, or does patience for a cheaper entry make more sense as valuation comes into focus next?
Most Popular Narrative: 32% Undervalued
On Simply Wall St’s most followed narrative, CECO Environmental’s fair value of $108.20 sits well above the recent $73.66 close, which puts the Thermon merger and growth plans under a brighter spotlight for investors.
Record-high backlog and robust pipeline growth, especially in power generation, industrial water, and natural gas infrastructure, suggest that increasing global enforcement of environmental regulations is translating into sustained demand and forward visibility for CECO's solutions, supporting topline revenue growth over the next 18 to 24 months.
See why 11 investors see CECO Environmental as 32% undervalued.
Result: Fair Value of $108.20 (UNDERVALUED)
Still, the CECO Environmental story can shift quickly if Thermon integration stumbles or if higher expenses and leverage squeeze margins more than analysts currently factor in.
Find out about the key risks to this CECO Environmental narrative.
Another View On CECO Environmental’s Valuation
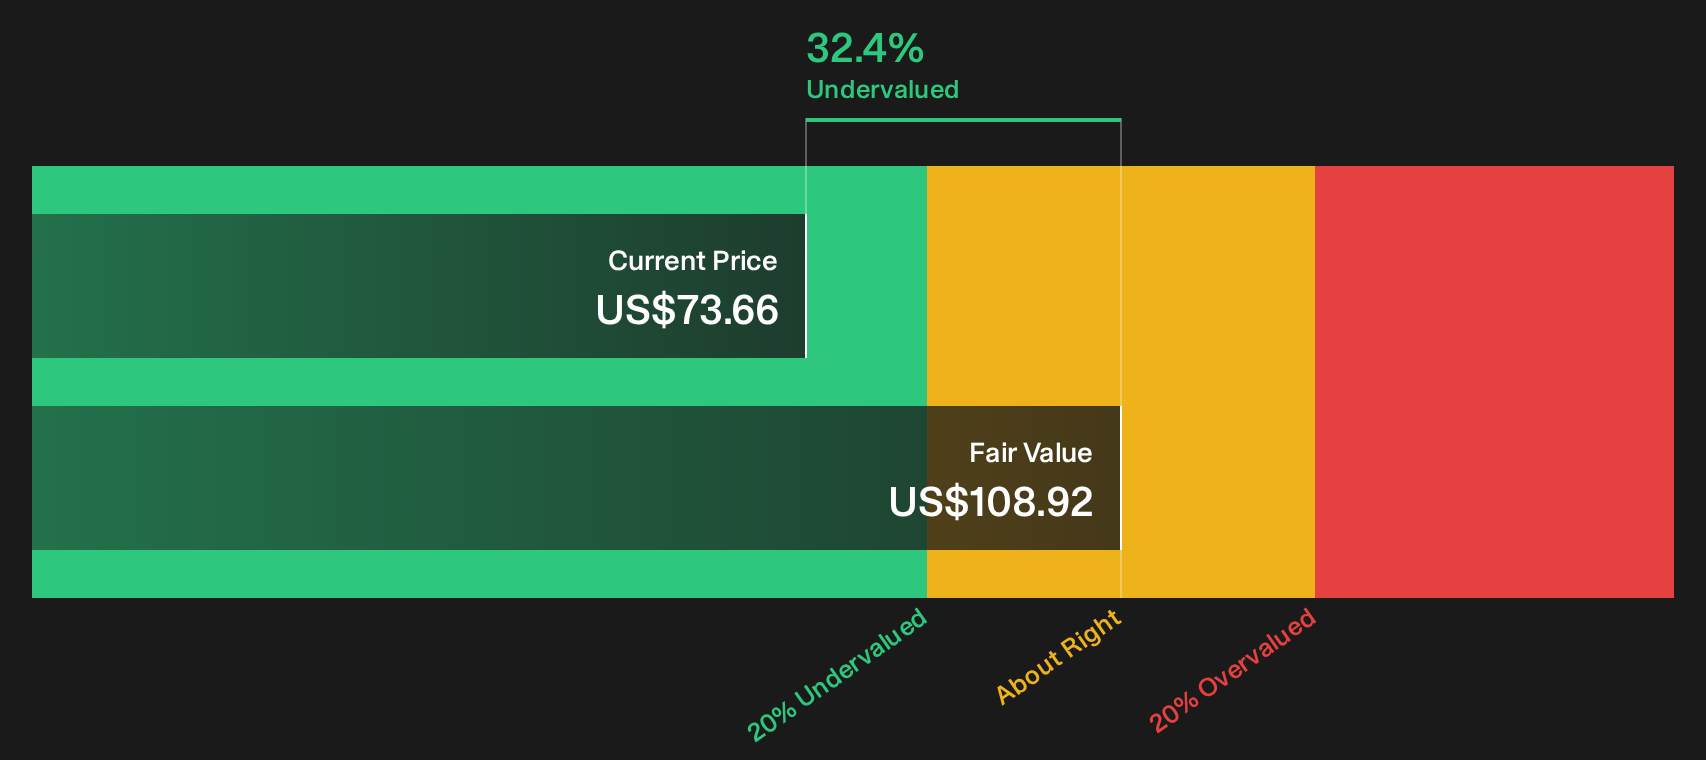
The SWS DCF model also flags CECO Environmental as undervalued, with an estimated future cash flow value of $108.92 against the current $73.66 share price. One model leans on analyst earnings targets, and the other on projected cash generation. Which set of assumptions do you trust more?
For a closer look at how this cash flow view is built step by step, run your eye over the Look into how the SWS DCF model arrives at its fair value.
Next Steps
Mixed feelings about CECO Environmental after these numbers are normal, especially with both risks and rewards in play, so move quickly, review the underlying data, and weigh the 2 key rewards and 1 important warning sign.
Looking for more investment ideas beyond CECO Environmental?
If CECO Environmental has your attention, do not stop here. Use the same data driven tools to surface other opportunities that might fit your style.
- Target resilient balance sheets and steady fundamentals with a focused list of solid balance sheet and fundamentals (26 results) that filters for financial strength upfront.
- Hunt for mispriced opportunities by scanning a curated pool of 31 high quality undervalued stocks that combine quality metrics with attractive valuations.
- Prioritise stability and income potential by reviewing a handpicked set of 7 dividend fortresses built around higher yields and durability.
This article by Simply Wall St is general in nature. We provide commentary based on historical data and analyst forecasts only using an unbiased methodology and our articles are not intended to be financial advice. It does not constitute a recommendation to buy or sell any stock, and does not take account of your objectives, or your financial situation. We aim to bring you long-term focused analysis driven by fundamental data. Note that our analysis may not factor in the latest price-sensitive company announcements or qualitative material. Simply Wall St has no position in any stocks mentioned.
Have feedback on this article? Concerned about the content? Get in touch with us directly. Alternatively, email editorial-team@simplywallst.com