
Workiva (WK) Rebounds On Analyst Upside, Is It Still Below Fair Value?
Workiva (WK) sits at an interesting crossroads for investors, with the share price near $71 and recent returns mixed. Short term performance has been modest, while the past 3 months show a stronger rebound.
For context, Workiva’s 1-day and 7-day share price returns of 2.3% and 2.3% follow a 30-day share price decline of about 7%, while the 90-day share price return of 38.2% contrasts with a year-to-date share price decline of 14.2% and a 1-year total shareholder return decline of 18.9%. This suggests recent momentum has picked up after a weaker stretch for long-term holders.
Compare Workiva’s rebound with other software stocks showing similar price action by scanning our hand picked list of 19 high quality undiscovered gems now.
The question now is whether Workiva’s sharp 90 day rebound reflects lasting confidence in a cloud reporting platform with rising revenue and net income, or a sentiment swing that future valuation work will test.
Most Popular Narrative: 21% Undervalued
Analysts following Workiva see more upside than the current $71.23 share price implies, with a fair value estimate of $89.80 built off detailed forecasts and a 9.16% discount rate.
The analysts have a consensus price target of $89.8 for Workiva based on their expectations of its future earnings growth, profit margins and other risk factors.
However, there is a degree of disagreement amongst analysts, with the most bullish reporting a price target of $105.0, and the most bearish reporting a price target of just $80.0.
See why 7 investors see Workiva as 21% undervalued.
Result: Fair Value of $89.80 (UNDERVALUED)
Still, the Workiva bull case leans on assumptions that could crack if European sustainability rules shift materially or if weaker global conditions hit software budgets.
Find out about the key risks to this Workiva narrative.
Another View: Workiva Looks Expensive On Earnings
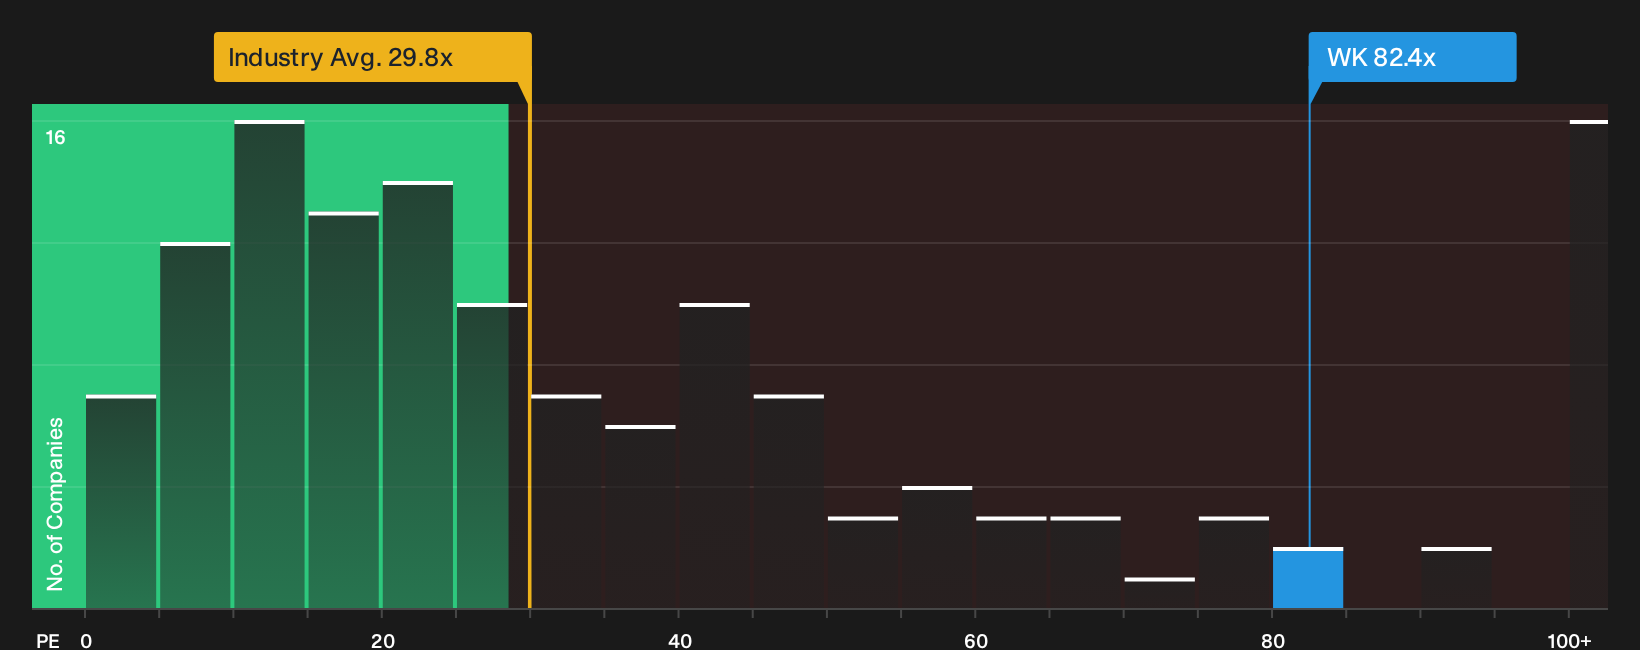
On price targets and fair value models, Workiva appears undervalued. On earnings multiples, the picture is very different. The current P/E of 82.4x is far above the US Software industry at 29.8x, the direct peer average at 46.4x, and even the 39.5x fair ratio that the market could eventually lean toward.
That gap signals valuation risk. If sentiment cools or growth expectations reset, a move closer to either peers or the fair ratio would mean a much lower share price than today.
Our approach weighs both methods. Analysts see upside on discounted future cash flows, yet the rich P/E reminds investors that paying far ahead of current earnings leaves little room for disappointment. Which lens do you trust more when you think about what you are really paying for with Workiva?
See what the numbers say about this price — find out in our valuation breakdown.
Next Steps
With mixed signals around Workiva’s valuation and earnings multiples, you should act promptly, review the underlying forecasts, and decide what matters most to you given the 4 key rewards and 3 important warning signs
Looking for more Workiva sized investment ideas?
Do not stop your research with Workiva alone. Broaden your watchlist using focused screeners that surface clear opportunities other investors may be missing right now.
- Target potential value opportunities by scanning a curated 31 high quality undervalued stocks that combine strong fundamentals with prices that sit below fair value estimates.
- Protect your downside first and hunt for resilience with a carefully filtered 31 resilient stocks with low risk scores that prioritises balance sheet strength and lower volatility profiles.
- Zero in on financial resilience by reviewing a list of solid balance sheet and fundamentals (25 results) that highlights companies with robust cash, manageable debt, and healthier fundamentals.
This article by Simply Wall St is general in nature. We provide commentary based on historical data and analyst forecasts only using an unbiased methodology and our articles are not intended to be financial advice. It does not constitute a recommendation to buy or sell any stock, and does not take account of your objectives, or your financial situation. We aim to bring you long-term focused analysis driven by fundamental data. Note that our analysis may not factor in the latest price-sensitive company announcements or qualitative material. Simply Wall St has no position in any stocks mentioned.
Have feedback on this article? Concerned about the content? Get in touch with us directly. Alternatively, email editorial-team@simplywallst.com