
NetApp (NTAP) Shares Climbed, So What Is Driving Attention Now?
NetApp (NTAP) is in the spotlight after a packed slate of announcements on 29 September 2026, including its AI-focused Novus storage platform, Keystone Sovereign for European data controls, and deeper ties with SAP, Oracle, and Supermicro.
That flurry of AI and cloud announcements landed after a powerful run in NetApp’s shares, with a 1-day share price return of 5.22% and a 30-day share price return of 21.92% feeding into a year-to-date share price gain of 112.52%. Meanwhile, the 3-year total shareholder return of 215.77% shows that the recent momentum has been building on an already strong longer-term record rather than appearing out of nowhere.
Scan how NetApp’s AI and cloud momentum compares with other potential breakouts across 90 AI infrastructure stocks in the same broader theme of data infrastructure and GPU-heavy workloads.
Bulls see NetApp’s AI push and recent 112.52% year-to-date rally as justified by real products and partners. Skeptics see exuberance. Which case does the current valuation actually support?
Most Popular NetApp Narrative: 14% Overvalued
NetApp’s most followed narrative puts fair value at $198.25 using an 8.74% discount rate, compared with the latest close at $226.27. That gap frames the core question for investors weighing AI upside against what is already reflected in the share price.
Accelerating adoption of AI and analytics workloads across industries is driving demand for unified, high-performance, and scalable data infrastructure, with NetApp securing over 125 AI wins in Q1 (more than doubling year-over-year); this trend is expected to drive revenue and earnings growth as AI deployments move from proofs of concept to large-scale production.
See why 52 investors see NetApp as 14% overvalued.
Result: Fair Value of $198.25 (OVERVALUED)
Still, NetApp’s reliance on hyperscaler partnerships and ongoing pressure on traditional hardware revenue leave the bullish AI narrative exposed if pricing power or demand softens.
Find out about the key risks to this NetApp narrative.
Another View: NetApp Through The DCF Lens
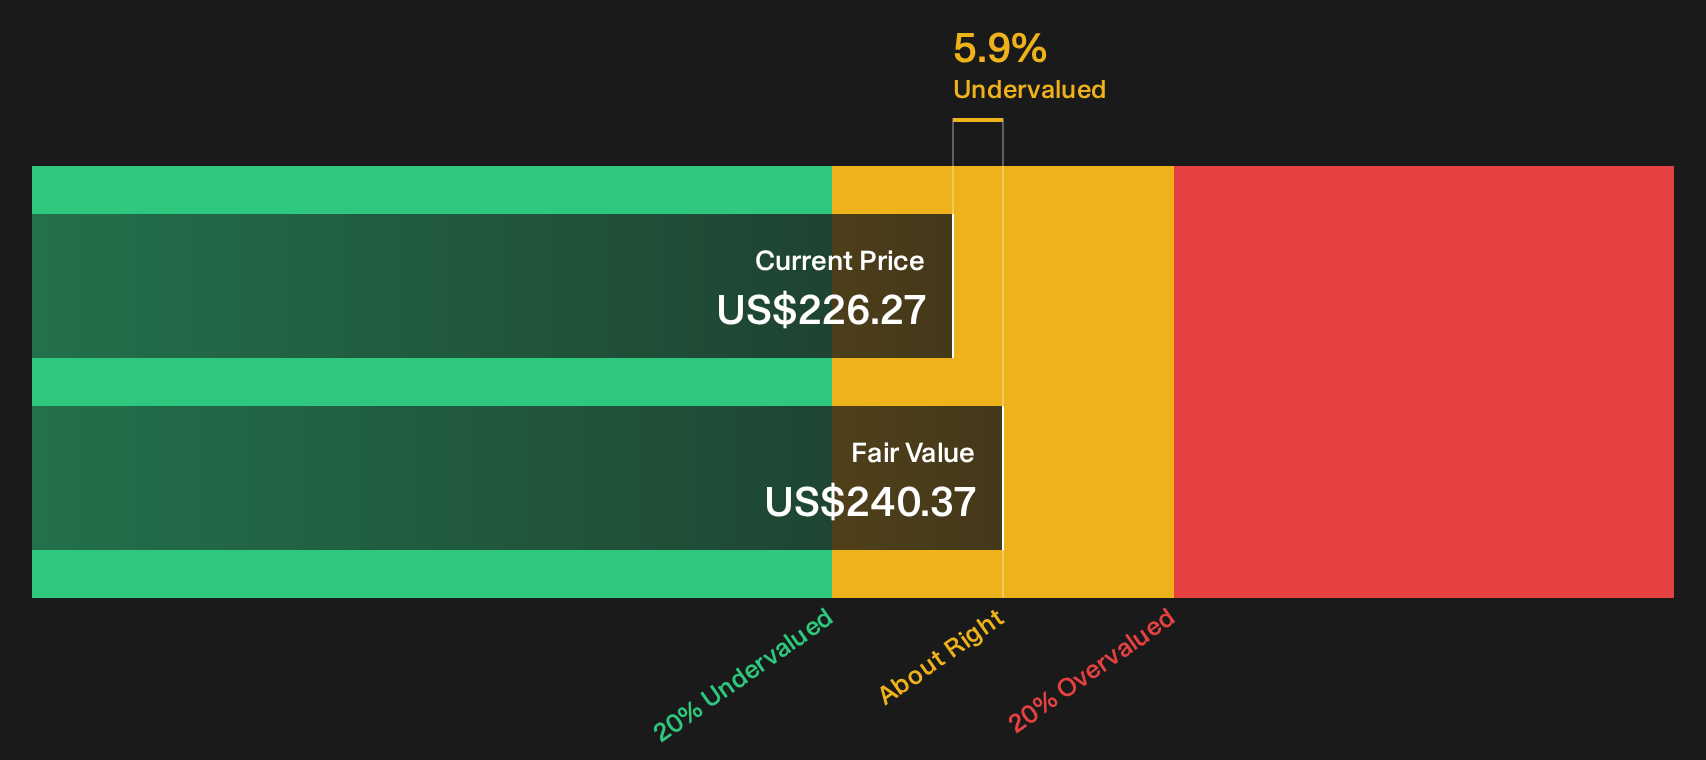
NetApp screens very differently when using the SWS DCF model. On this approach, the shares trade around $226.27 compared with an estimated future cash flow value of $240.37, which implies the stock is 5.9% below that fair value estimate. So is the richer earnings multiple masking a DCF gap you are comfortable with?
For a closer look at how that cash flow based estimate is built, Look into how the SWS DCF model arrives at its fair value.
Simply Wall St performs a discounted cash flow (DCF) on every stock in the world every day (check out NetApp for example). We show the entire calculation in full. You can track the result in your watchlist or portfolio and be alerted when this changes, or use our stock screener to discover 31 high quality undervalued stocks. If you save a screener we even alert you when new companies match - so you never miss a potential opportunity.
Next Steps
Mixed messages on NetApp’s valuation and AI story are clear. Move fast, pull up the data, and decide where you sit on the optimism versus caution spectrum. To help frame that view in a single snapshot, weigh our breakdown of 3 key rewards and 1 important warning sign
Looking for more NetApp style investment ideas?
If NetApp’s AI story has you thinking bigger, do not stop at one ticker. Use focused screens to surface opportunities that might otherwise slip past you.
- Target quality at a discount by scanning a curated set of 31 high quality undervalued stocks that combine strong fundamentals with prices that may not fully reflect them.
- Lock in potential income streams by reviewing 7 dividend fortresses that pair higher yields with an emphasis on resilience and payout support.
- Protect your downside by filtering for 31 resilient stocks with low risk scores that score well on financial strength so you are not caught off guard when conditions change.
This article by Simply Wall St is general in nature. We provide commentary based on historical data and analyst forecasts only using an unbiased methodology and our articles are not intended to be financial advice. It does not constitute a recommendation to buy or sell any stock, and does not take account of your objectives, or your financial situation. We aim to bring you long-term focused analysis driven by fundamental data. Note that our analysis may not factor in the latest price-sensitive company announcements or qualitative material. Simply Wall St has no position in any stocks mentioned.
Have feedback on this article? Concerned about the content? Get in touch with us directly. Alternatively, email editorial-team@simplywallst.com