
B.F (BIT:BFG) Following Half Year Results Looks Pricey At 1x Sales
B.F (BIT:BFG) just released half year results to June 30, 2026, providing fresh figures on sales, revenue and profit, together with a lower earnings per share figure than last year.
The fresh half year update landed after a steep run in B.F’s share price. It now sits at €7.92 following a 49.43% 1 month share price return and an 88.12% year to date share price gain, while the 1 year total shareholder return of 88.67% suggests momentum has been building rather than fading.
Scan how B.F compares with other agro and food producers showing strong price momentum and fundamental support by running the curated 615 high quality undiscovered gems before you move on from this update.
B.F has surged on fresh figures, yet earnings per share have slipped and the share price has run hard. Does the current valuation still leave enough upside to justify the risk for new buyers?
Preferred Multiple of Price-to-Sales: Is it justified?
B.F now trades on a P/S ratio of roughly 1x, which looks punchy against some benchmarks given the share price surge to €7.92.
The price to sales multiple compares the total market value of the equity with the revenue generated by the business. For a diversified agro industrial group like B.F, it offers a simple way to see how much investors are paying for each euro of sales across pasta, rice, vegetables and related products.
On one hand, B.F screens as good value versus its closest peer set, with a P/S of 1x compared with a 1.9x average for that group. On the other hand, the same 1x multiple is described as expensive compared with the broader European food sector on 0.8x, and above an estimated fair P/S ratio of 0.6x that the market could move toward if enthusiasm cools.
Explore the SWS fair ratio for B.F.
Result: Price-to-sales of 1x (OVERVALUED)
Still, B.F’s rapid share price gains and lower earnings per share leave little room for disappointment if revenue momentum or profit trends soften.
Find out about the key risks to this B.F narrative.
Another View on B.F’s valuation
The first lens, using P/S, flags B.F as expensive. A second lens, our DCF model, goes even further. It puts future cash flow value at about €0.76 per share against today’s €7.92, which also points to an overvalued picture. So which signal should matter more to you right now?
Look into how the SWS DCF model arrives at its fair value.
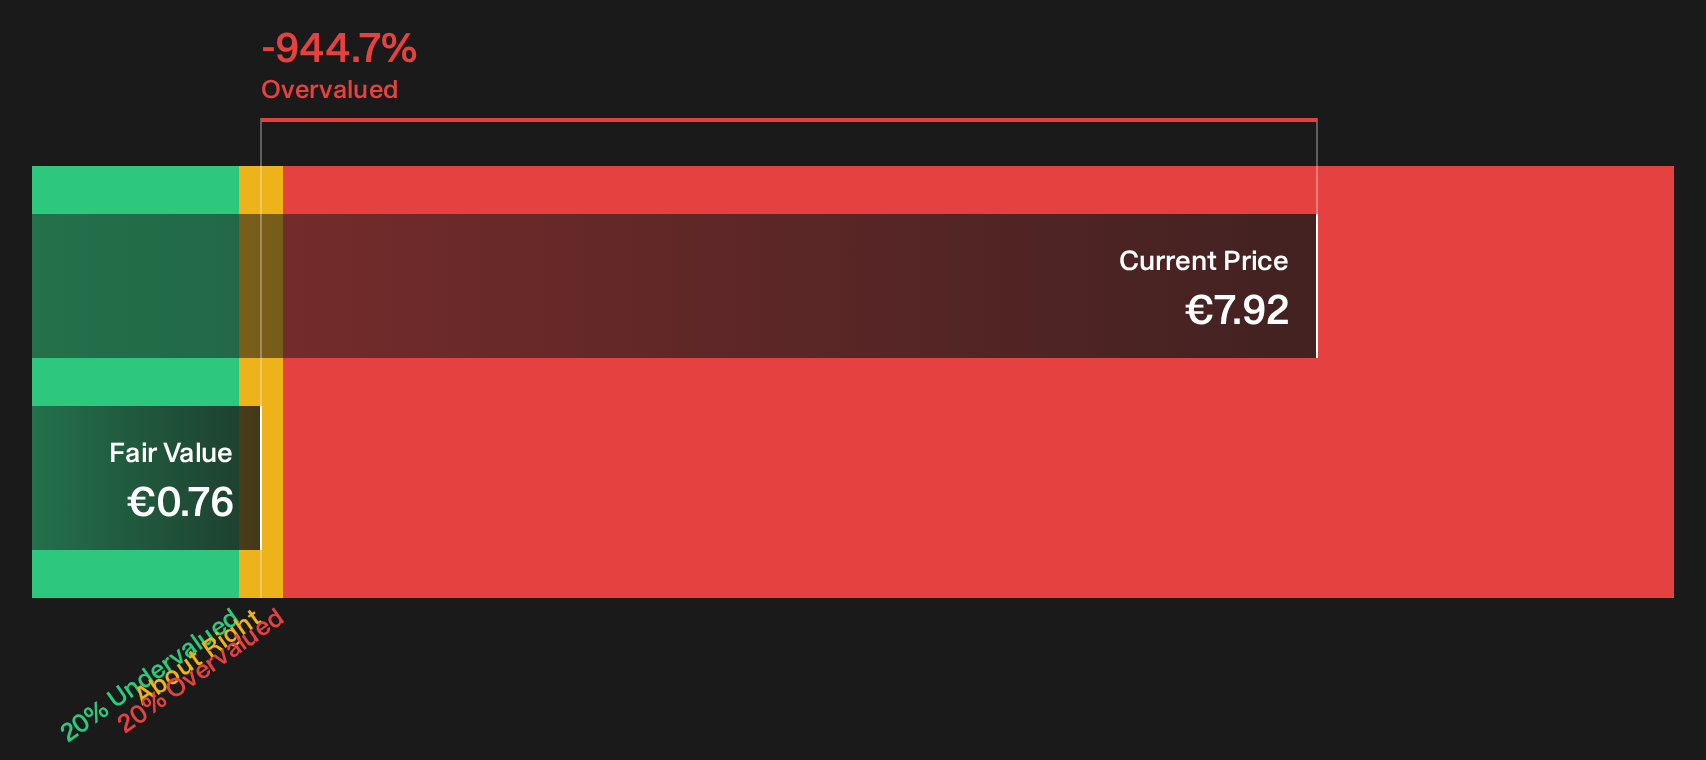
Simply Wall St performs a discounted cash flow (DCF) on every stock in the world every day (check out B.F for example). We show the entire calculation in full. You can track the result in your watchlist or portfolio and be alerted when this changes, or use our stock screener to discover 192 high quality undervalued stocks. If you save a screener we even alert you when new companies match - so you never miss a potential opportunity.
Next Steps
Mixed messages on B.F’s valuation and fundamentals can feel unsettling, so move fast, review the underlying numbers yourself, then weigh the balance of 2 key rewards and 1 important warning sign
Looking for more B.F investment ideas?
If B.F now feels fully priced to you, broaden your watchlist and look for fresher opportunities using focused stock screens built around different strengths.
- Target resilient income by reviewing companies tagged as potential 168 dividend fortresses that may offer stronger yield support than a pure price momentum story.
- Hunt for quality at a discount by scanning the 192 high quality undervalued stocks and see which businesses combine healthier fundamentals with less demanding valuations.
- Prioritise capital protection by filtering for 227 resilient stocks with low risk scores so you are not relying on a single high momentum stock to carry your returns.
This article by Simply Wall St is general in nature. We provide commentary based on historical data and analyst forecasts only using an unbiased methodology and our articles are not intended to be financial advice. It does not constitute a recommendation to buy or sell any stock, and does not take account of your objectives, or your financial situation. We aim to bring you long-term focused analysis driven by fundamental data. Note that our analysis may not factor in the latest price-sensitive company announcements or qualitative material. Simply Wall St has no position in any stocks mentioned.
Have feedback on this article? Concerned about the content? Get in touch with us directly. Alternatively, email editorial-team@simplywallst.com