
Is Mainova (DB:MNV6) Cheap Following Its Strong Half Year Earnings?
Why Mainova’s Latest Earnings Matter For Shareholders
Mainova (DB:MNV6) just released half year results that put fresh numbers behind the utility’s profitability story. Sales reached €1,954.28m, while net income came in at €159.13m and earnings per share were €23.67.
The earnings release lands after a solid run in the Mainova share price, with a year to date share price return of 11.76% and a 1 year total shareholder return of 17.48%, even though long term total shareholder returns over 3 and 5 years have been weaker, as earlier periods weighed on performance.
Scan how Mainova’s earnings momentum compares with other regulated utilities by running the curated 227 resilient stocks with low risk scores alongside your current watchlist.
Mainova’s earnings jump and double digit returns have already rewarded early holders. The next question is whether the current price still leaves meaningful upside on the table or if most of the gain is already booked.
Preferred P/E Multiple Of 11.7x: Is It Justified For Mainova?
Mainova trades on a P/E of 11.7x, while the last close sits at €380, which points to a lower earnings multiple than both the German market and the wider integrated utilities group.
The P/E ratio links today’s share price to the profit that Mainova generates per share. For a regulated utility where earnings and cash generation matter more than rapid expansion, P/E is often the simplest way to see how much investors are paying for each euro of net income.
With Mainova on 11.7x versus the German market at 16x, the valuation implies investors are paying less for each euro of earnings than they are for the average domestic stock. Compared with the global integrated utilities peer average of 17.7x and a peer group at 23.3x, the discount is even stronger. This suggests the market is pricing Mainova’s profits more cautiously than those of similar utilities and that the multiple could move closer to those levels if sentiment changes.
See what the numbers say about this price — find out in our valuation breakdown.
Result: Price-to-earnings of 11.7x (UNDERVALUED).
Still, Mainova’s weaker 3 and 5 year total returns, along with its role as a subsidiary of Stadtwerke Frankfurt, can limit liquidity and influence over capital decisions.
Find out about the key risks to this Mainova narrative.
Another View On Mainova’s Value
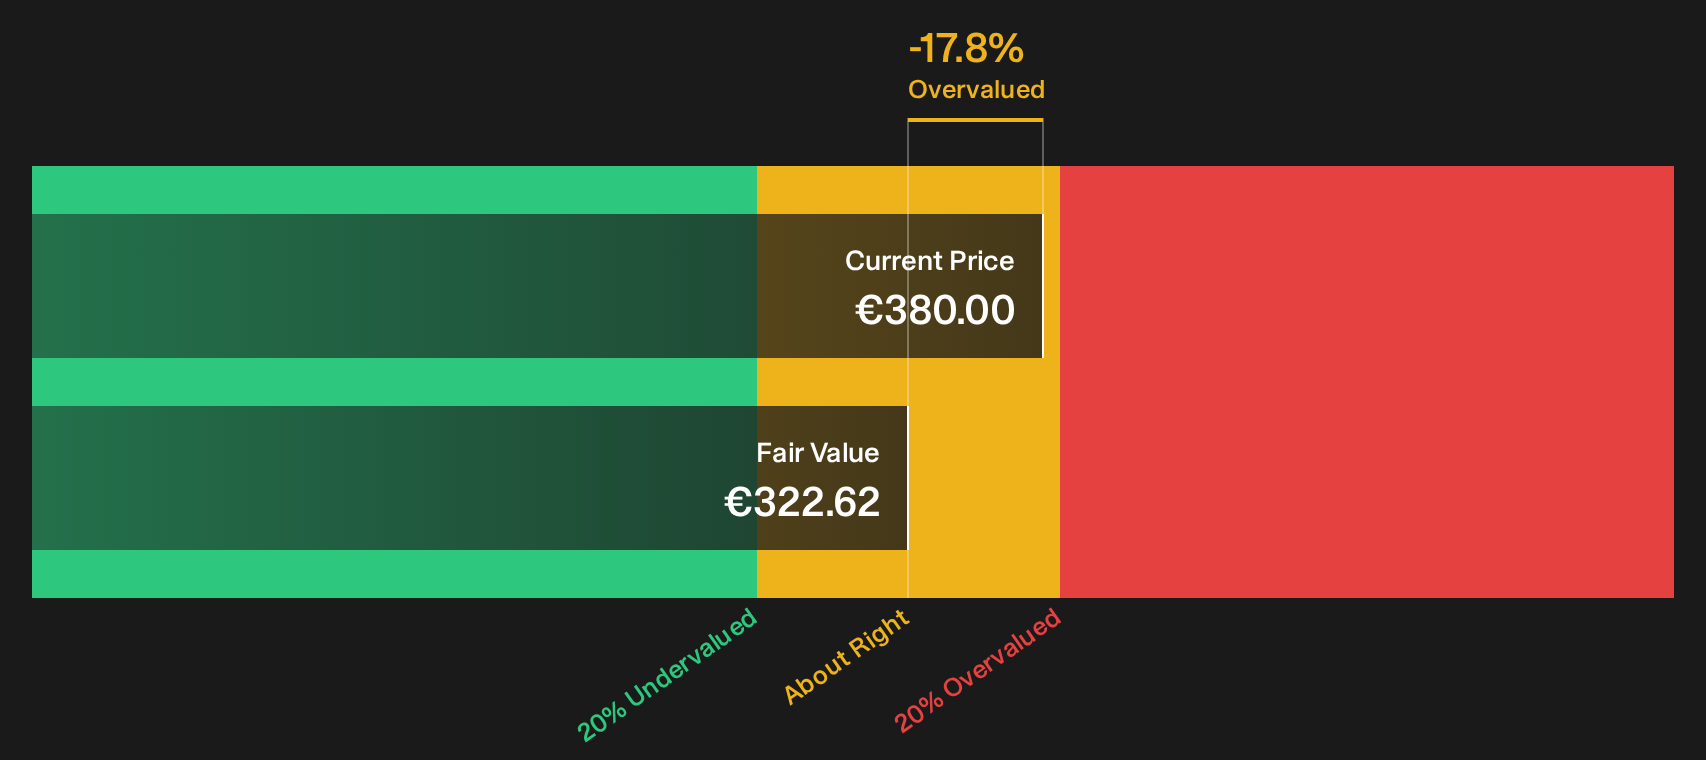
The P/E discount paints Mainova as cheap, yet the SWS DCF model tells a cooler story. On that cash flow view, an estimated value of €322.62 sits below the current €380 share price, which points to the stock trading above this fair value range.
The gap between an apparently attractive 11.7x P/E and an overvaluation flag from the DCF model puts you in the hot seat. Which lens do you trust more when earnings quality looks sound but long term profit trends have softened, and how much weight do you give to each signal?
Look into how the SWS DCF model arrives at its fair value.
Simply Wall St performs a discounted cash flow (DCF) on every stock in the world every day (check out Mainova for example). We show the entire calculation in full. You can track the result in your watchlist or portfolio and be alerted when this changes, or use our stock screener to discover 192 high quality undervalued stocks. If you save a screener we even alert you when new companies match - so you never miss a potential opportunity.
Next Steps
If this mix of cautious signals and apparent value on Mainova feels mixed to you, that is the point. It is exactly why you should pressure test the underlying numbers yourself, weigh both sides of the story, and then anchor your own stance using the 2 key rewards and 2 important warning signs
Looking For More Ideas Beyond Mainova?
If Mainova has sharpened your thinking, do not stop here. Fresh ideas often come from comparing solid alternatives that fit your risk and income comfort zone.
- Target resilient balance sheets by scanning the list of solid balance sheet and fundamentals (206 results) that pairs financial strength with fundamentals you can scrutinise in detail.
- Hunt for potential mispricing by reviewing the 192 high quality undervalued stocks where quality businesses trade on valuations that may not fully reflect their fundamentals.
- Stack your watchlist with income candidates by screening through the 168 dividend fortresses built to highlight higher yield opportunities with staying power.
This article by Simply Wall St is general in nature. We provide commentary based on historical data and analyst forecasts only using an unbiased methodology and our articles are not intended to be financial advice. It does not constitute a recommendation to buy or sell any stock, and does not take account of your objectives, or your financial situation. We aim to bring you long-term focused analysis driven by fundamental data. Note that our analysis may not factor in the latest price-sensitive company announcements or qualitative material. Simply Wall St has no position in any stocks mentioned.
Have feedback on this article? Concerned about the content? Get in touch with us directly. Alternatively, email editorial-team@simplywallst.com