
W.W. Grainger (GWW) Could Be 3% Undervalued After Its Recent Pullback
W.W. Grainger (GWW) has drawn fresh attention after recent trading left the stock about 3% below its analyst-consensus price target. This has prompted investors to reassess performance metrics and current valuation.
Over the past year, W.W. Grainger has combined short-term volatility with a strong overall run. The recent 30-day share price return is down 2.84% and the 90-day return is down 5.13%. However, the year-to-date share price return of 28.20% and the 1-year total shareholder return of 35.31% indicate that longer-term momentum remains intact despite the recent cooling.
Compare W.W. Grainger's recent run with a hand picked group of industrials showing strong price action and fundamentals using the list of solid balance sheet and fundamentals (25 results)
The question now is simple. After a long run and only a small gap to analyst targets, is most of W.W. Grainger’s upside already in the rear-view mirror, or do the current valuation markers still leave room ahead?
Most Popular Narrative: 3% Undervalued
Against a last close of $1,286.84, the most followed narrative places W.W. Grainger's fair value at $1,331.64, which implies a small valuation cushion built on execution rather than hype.
Ongoing expansion and automation of W.W. Grainger's distribution network, including the new 550,000 square foot Northwest Distribution Center in Oregon and the large Houston facility planned for 2028, is expected to support higher service levels and more efficient fulfillment, which can influence revenue growth and operating margin over time.
See why 29 investors see W.W. Grainger as 3% undervalued.
Result: Fair Value of $1,331.64 (UNDERVALUED)
Still, the bullish script around W.W. Grainger could be knocked off course if fuel and freight costs stay elevated or if private label inflation keeps compressing product economics.
Find out about the key risks to this W.W. Grainger narrative.
Another View: Rich Multiple For W.W. Grainger
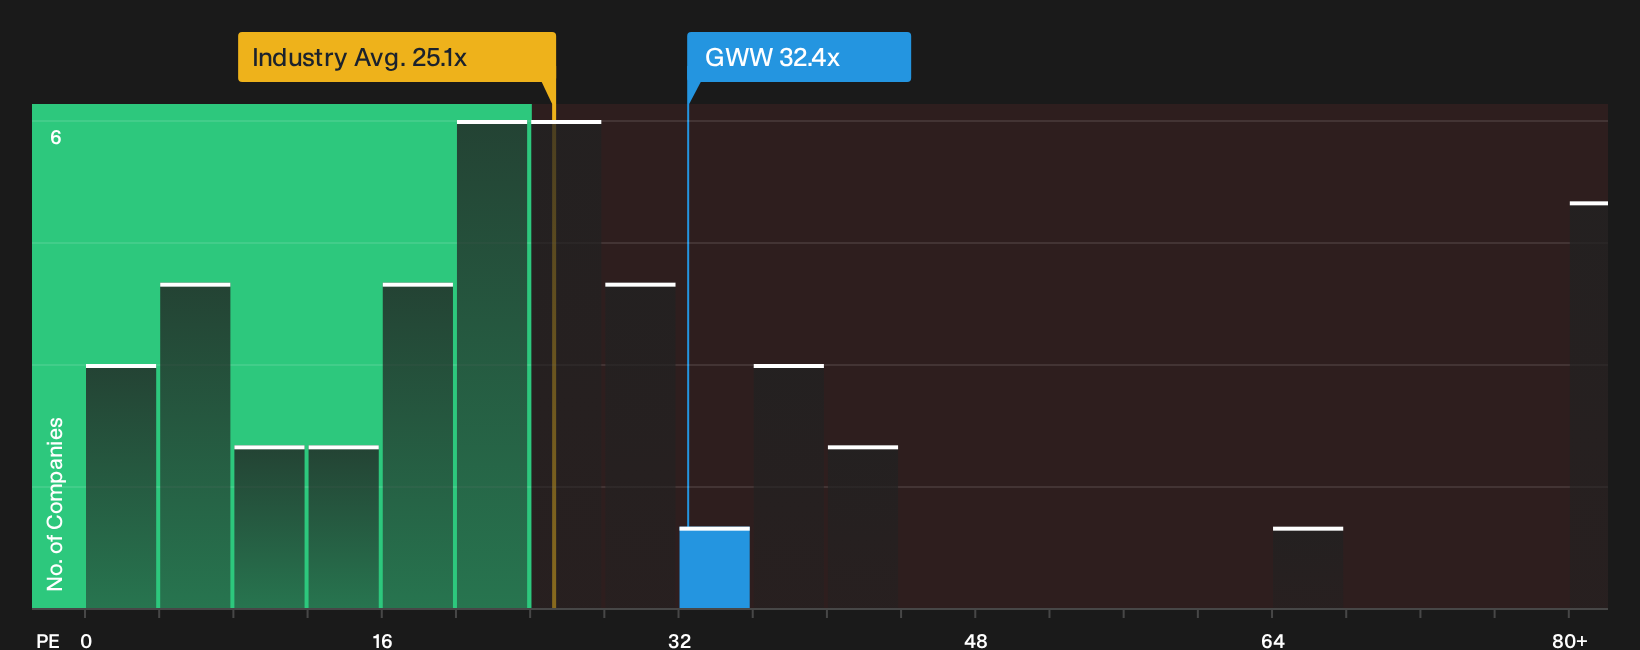
The story looks different when you switch from fair value narratives to the P/E label on W.W. Grainger. At 32.4x earnings, the stock trades well above the US Trade Distributors group on 25.1x and above its own fair ratio of 25.6x. That gap points to valuation risk if expectations cool, even with strong execution.
For a closer look at how this earnings multiple compares with peers and that fair ratio anchor, See what the numbers say about this price — find out in our valuation breakdown.
Next Steps
Mixed signals on W.W. Grainger's valuation and risk reward profile can feel messy. Move quickly, review the full data set, and weigh both the potential upside and the pressure points captured in the 1 key reward and 1 important warning sign.
Looking for more investment ideas beyond W.W. Grainger?
If W.W. Grainger has you thinking harder about valuation and momentum, you can use that same focus to scan wider opportunities and reduce the risk of leaving potential gains on the table.
- Target value opportunities by reviewing companies that combine strong fundamentals with appealing pricing through the 27 high quality undervalued stocks.
- Strengthen portfolio resilience by filtering for businesses with robust finances using the 31 resilient stocks with low risk scores.
- Identify quality businesses that receive less attention through the 19 high quality undiscovered gems.
This article by Simply Wall St is general in nature. We provide commentary based on historical data and analyst forecasts only using an unbiased methodology and our articles are not intended to be financial advice. It does not constitute a recommendation to buy or sell any stock, and does not take account of your objectives, or your financial situation. We aim to bring you long-term focused analysis driven by fundamental data. Note that our analysis may not factor in the latest price-sensitive company announcements or qualitative material. Simply Wall St has no position in any stocks mentioned.
Have feedback on this article? Concerned about the content? Get in touch with us directly. Alternatively, email editorial-team@simplywallst.com