
Royal Gold (RGLD) Could Be 26% Undervalued As Its Pullback Tests The Story
Royal Gold (RGLD) has drawn attention after recent trading left the share price at US$227.89, with the stock down over the past month but higher over the past three months.
Recent trading has been choppy, with a 1-day share price return of 2.76% lower and a 30-day share price return of 13.06% lower. However, Royal Gold still shows positive momentum, with a 90-day share price return of 14.64% and a 1-year total shareholder return of 11.98%.
Scan beyond Royal Gold and size up other precious metal players with the 36 elite gold producer stocks that investors are watching for the next potential move in momentum.
Royal Gold has pulled back sharply in the past month, yet still carries a solid longer term run behind it. Do you put fresh money to work now, or hold out for a cheaper entry before the valuation work starts?
Most Popular Narrative: 26% Undervalued
Compared with the last close at $227.89, the most followed valuation storyline pegs Royal Gold’s fair value closer to $309.83. This frames today’s pullback as a gap between near term disappointment and a longer term cash flow view.
Rapid debt reduction of about US$900 million by mid 2026 and liquidity of roughly US$1.2b, alongside ongoing debt repayment funded partly by over US$200 million of noncore asset sales and continued dividend payments, improves balance sheet flexibility for future royalty and streaming investments that can influence long term revenue and earnings growth.
See why 79 investors see Royal Gold as 26% undervalued.
Result: Fair Value of $309.83 (UNDERVALUED)
Still, the Royal Gold narrative can be tested quickly if earnings misses persist or if further analyst estimate cuts and insider selling continue to erode confidence.
Find out about the key risks to this Royal Gold narrative.
Another View on Royal Gold’s Valuation
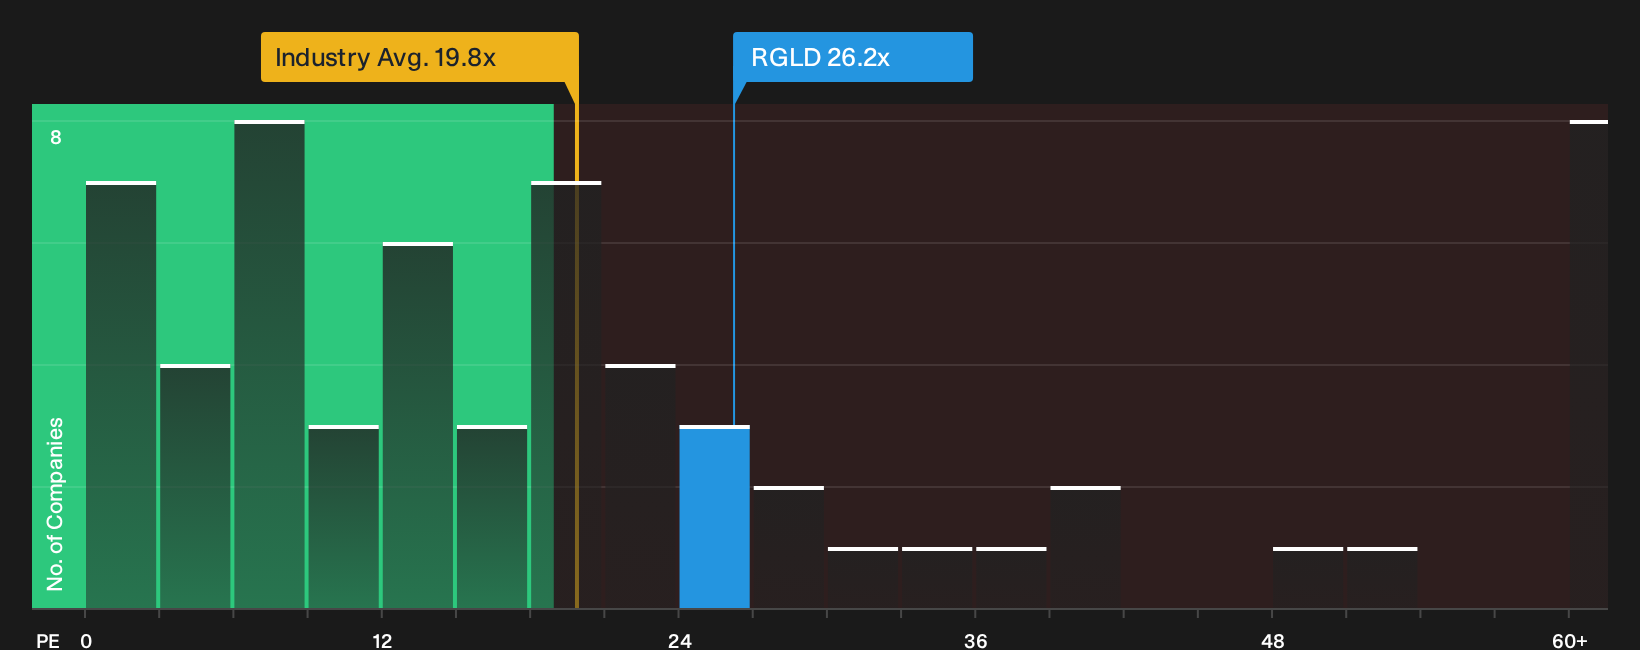
That 26% gap to the US$309.83 fair value narrative leans on long term earnings projections. A simpler cross check looks at today’s pricing. Royal Gold trades on a P/E of 26.2x, compared with a fair ratio of 22.3x, the US Metals and Mining sector at 19.8x, and peers at 17.6x. That kind of premium can either signal quality that investors are willing to pay up for, or leave less room if sentiment cools.
It helps to stress test that premium against the detailed valuation work in the background so you can judge whether the current multiple feels stretched or justified for your own return expectations. See what the numbers say about this price — find out in our valuation breakdown.
Next Steps
Mixed signals on Royal Gold’s valuation story. For a clear view, move quickly, pull up the full dataset, and weigh the 3 key rewards and 1 important warning sign.
Looking for more investment ideas beyond Royal Gold?
Use these screeners to quickly surface fresh opportunities that match your style before the next move leaves you on the sidelines.
Scan for quality, compare fundamentals, and pressure test your Royal Gold view against other options with targeted lists built from the same data backbone.
- Target potential mispricings by reviewing a 29 high quality undervalued stocks that could offer a more attractive entry point than what you see on your current watchlist.
- Lock in reliability by focusing on a list of solid balance sheet and fundamentals (25 results) that can help you filter for companies with stronger financial footing.
- Spot early opportunities by reviewing a 20 high quality undiscovered gems before broader attention and liquidity move in.
This article by Simply Wall St is general in nature. We provide commentary based on historical data and analyst forecasts only using an unbiased methodology and our articles are not intended to be financial advice. It does not constitute a recommendation to buy or sell any stock, and does not take account of your objectives, or your financial situation. We aim to bring you long-term focused analysis driven by fundamental data. Note that our analysis may not factor in the latest price-sensitive company announcements or qualitative material. Simply Wall St has no position in any stocks mentioned.
Have feedback on this article? Concerned about the content? Get in touch with us directly. Alternatively, email editorial-team@simplywallst.com