
Tsuruha Holdings (TSE:3391) Cuts Interim Dividend, Where Does Fair Value Sit?
Tsuruha Holdings (TSE:3391) cut its interim dividend guidance to ¥24 per share for the six months to August 31, 2026, compared with ¥133.50 a year earlier, following a 5-for-1 stock split in September 2025.
At a share price of ¥2,132 on 7 October 2026, Tsuruha Holdings has posted a 1-day share price return of 2.25% and a 7-day gain of 1.72%. However, the stock remains under pressure, with the 30-day share price down 8.93% and the year-to-date share price return down 25.84%.
Compare Tsuruha Holdings' dividend reset with other potential income plays by scanning our curated 32 dividend fortresses that may better fit your yield expectations.
Tsuruha Holdings trades well below both analyst targets and some intrinsic value estimates after this dividend reset and share price slide. Where might fair value reasonably fall within that gap?
Discounted Cash Flow fair value for Tsuruha Holdings
On Simply Wall St's numbers, Tsuruha Holdings screens as heavily undervalued, with the SWS DCF model pointing to a fair value of ¥6,930.55 compared to a last close of ¥2,132.
The SWS DCF model estimates what a business might be worth by projecting its future cash flows and then discounting those back to today. It treats the company as a stream of future cash the business could generate for shareholders, rather than only looking at near term earnings or dividends.
For Tsuruha Holdings, that approach matters because the group reports forecast annual earnings growth of 14.5% alongside revenue growth estimates of 9.7% per year, and it already has high quality earnings with improving profit margins. Those inputs feed into the projected cash flows that underpin the DCF outcome, which is why the model produces such a large gap between price and estimated intrinsic value.
Look into how the SWS DCF model arrives at its fair value.
Result: DCF Fair value of ¥6,930.55 (UNDERVALUED)
Still, the share price is down 25.84% year to date and analysts see only a 23.88% gap to their average target, so sentiment toward Tsuruha Holdings could remain fragile.
Find out about the key risks to this Tsuruha Holdings narrative.
Tsuruha Holdings valuation looks different on earnings multiples
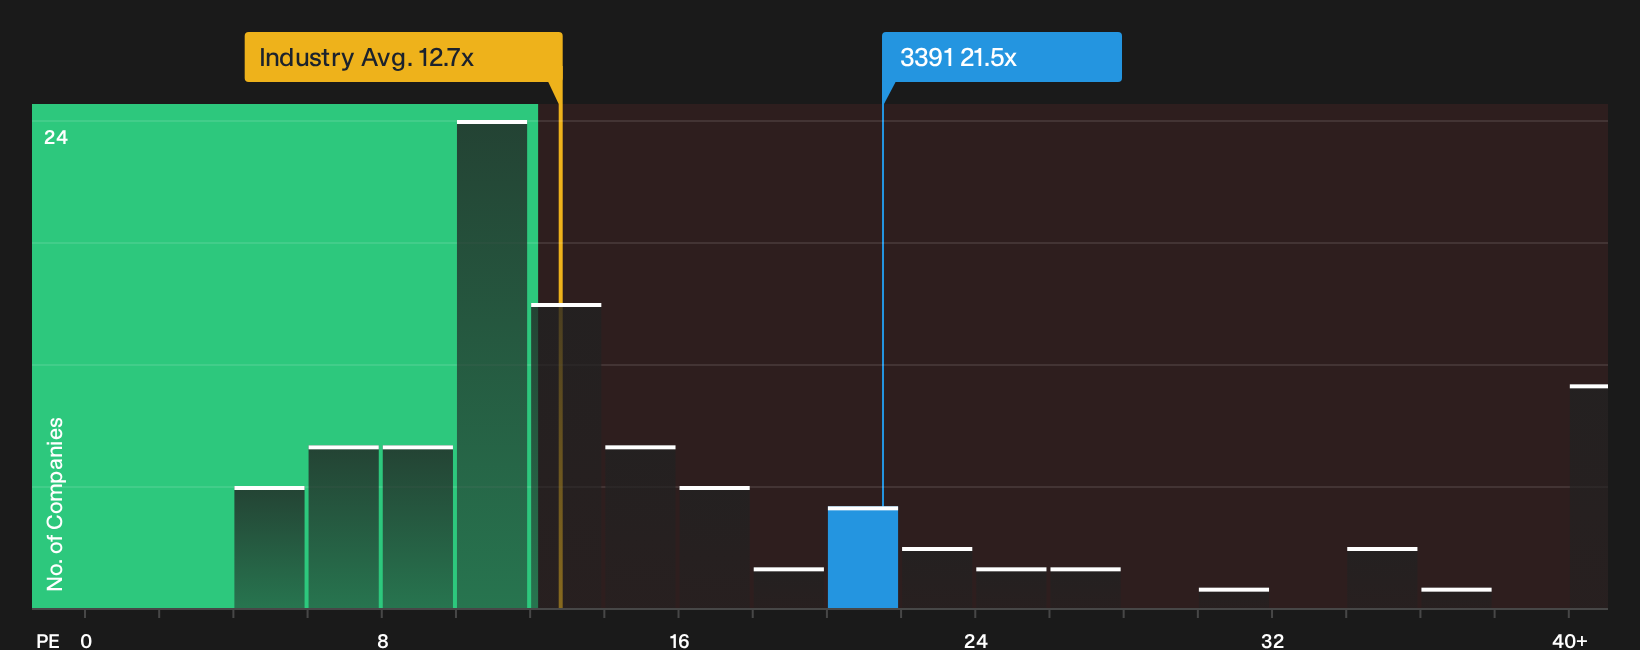
Tsuruha Holdings looks cheap on the SWS DCF model, yet the picture flips when you line the share up against earnings based yardsticks. The stock trades on a P/E of 21.5x compared with a fair ratio of 19.2x, the Consumer Retailing sector on 12.7x and direct peers on 15.2x. That richer multiple suggests investors are paying up for earnings even after the drawdown, so an important question is how comfortable you are relying on the cash flow model to close that gap.
See what the numbers say about this price — find out in our valuation breakdown.
Simply Wall St performs a discounted cash flow (DCF) on every stock in the world every day (check out Tsuruha Holdings for example). We show the entire calculation in full. You can track the result in your watchlist or portfolio and be alerted when this changes, or use our stock screener to discover 14 high quality undervalued stocks. If you save a screener we even alert you when new companies match - so you never miss a potential opportunity.
Next Steps
Sentiment on Tsuruha Holdings is clearly mixed, with valuation signals and dividend changes pulling in different directions. Treat this as a prompt to test the numbers yourself and decide how comfortable you are with the balance of risk and reward. To weigh that trade off, start with the 5 key rewards and 1 important warning sign
Want more ideas beyond Tsuruha Holdings?
Do not stop your research with a single ticker. Broaden your watchlist with other candidates that match different goals and risk levels.
- Target reliable income potential by scanning a curated pool of yield opportunities through the 32 dividend fortresses.
- Hunt for potential mispriced opportunities by running your filters across the 75 high quality undiscovered gems.
- Prioritise resilience and capital preservation by focusing on companies highlighted in the 22 resilient stocks with low risk scores.
This article by Simply Wall St is general in nature. We provide commentary based on historical data and analyst forecasts only using an unbiased methodology and our articles are not intended to be financial advice. It does not constitute a recommendation to buy or sell any stock, and does not take account of your objectives, or your financial situation. We aim to bring you long-term focused analysis driven by fundamental data. Note that our analysis may not factor in the latest price-sensitive company announcements or qualitative material. Simply Wall St has no position in any stocks mentioned.
Have feedback on this article? Concerned about the content? Get in touch with us directly. Alternatively, email editorial-team@simplywallst.com