
Empire State Realty OP (ESBA) Tries To Rebound As Valuation Questions Grow
Empire State Realty OP Stock Performance Snapshot
Empire State Realty OP (ESBA) has been on many watchlists after a recent stretch of weaker returns, with the stock closing at US$4.31 and declining over the past month and past 3 months.
Short term momentum in Empire State Realty OP has picked up with a 7.75% 7 day share price return. However, this sits against a much weaker backdrop, with the 90 day share price return down 21.35% and the 1 year total shareholder return down 40.47%.
Scan beyond Empire State Realty OP and compare its recent pullback with a curated group of real estate players and other income focused businesses in the 8 dividend fortresses.
Empire State Realty OP trades at US$4.31 while internal fair value estimates imply a much higher figure. Is that gap a genuine margin of safety, or a signal that expectations need recalibrating?
Preferred Multiple of 1.6x Price-to-Sales: Is it justified?
On simple valuation math, Empire State Realty OP screens as cheap. The units last closed at $4.31, while internal estimates suggest the stock trades at a sizeable discount to both an intrinsic value of $13.95 based on the SWS DCF model and to peers on a P/S basis.
The preferred gauge here is the price-to-sales ratio. ESBA trades on a P/S of 1.6x, which compares its $1.22b market value with $782.8m of reported revenue. For a real estate partnership with both Observatory and broader property operations, this measure focuses on top line rather than earnings, which have been distorted by one off items.
That 1.6x sales multiple sits well below the North American REITs industry average of 3.3x and also trails a peer group average of 3.8x. The gap is wide, and the valuation statements classify ESBA as good value on both comparisons. However, investors still need to weigh this against weaker recent returns and a decline in net profit margins to 0.6% from 8.5%.
Alongside the multiples view, the SWS DCF model points to a large difference between price and future cash flow value. ESBA at $4.31 is described as trading below an estimated future cash flow value of $13.95 per unit, which frames the current quote as heavily discounted on that methodology.
See what the numbers say about this price — find out in our valuation breakdown.
Result: Price-to-Sales of 1.6x (UNDERVALUED)
Still, Empire State Realty OP faces pressure from weaker multi year total returns and a slim 0.6% net profit margin, which leaves little cushion for setbacks.
Find out about the key risks to this Empire State Realty OP narrative.
Another View on Empire State Realty OP Valuation
Price-based ratios paint one picture. The SWS DCF model offers another. On that framework, Empire State Realty OP at $4.31 screens as undervalued compared with an estimated future cash flow value of $13.95 per unit. Is the model too generous, or is the market too harsh?
Look into how the SWS DCF model arrives at its fair value.
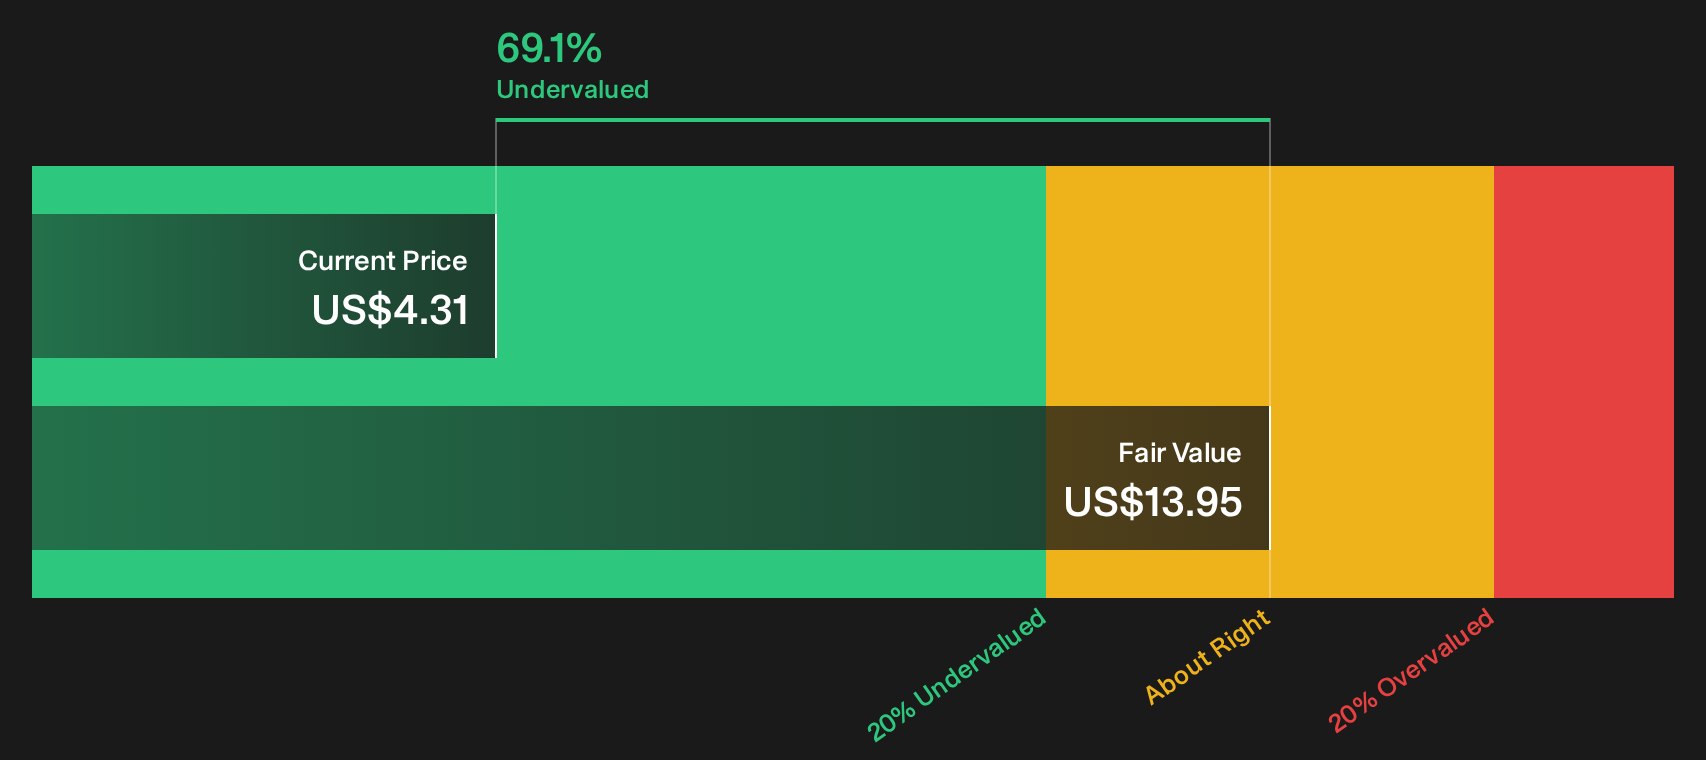
Simply Wall St performs a discounted cash flow (DCF) on every stock in the world every day (check out Empire State Realty OP for example). We show the entire calculation in full. You can track the result in your watchlist or portfolio and be alerted when this changes, or use our stock screener to discover 29 high quality undervalued stocks. If you save a screener we even alert you when new companies match - so you never miss a potential opportunity.
Next Steps
Mixed signals around Empire State Realty OP can feel confusing, so treat this as a prompt to move quickly, test the numbers yourself, and decide where you stand using the 1 key reward and 4 important warning signs.
Looking for more investment ideas beyond Empire State Realty OP?
Do not stop your research with Empire State Realty OP. Broaden your watchlist with a few focused screens that surface different types of opportunities across the market.
- Target stronger balance sheets by reviewing companies in the list of solid balance sheet and fundamentals (25 results).
- Hunt for mispriced quality by scanning the 29 high quality undervalued stocks.
- Spot cash return potential early by checking out the 8 dividend fortresses.
This article by Simply Wall St is general in nature. We provide commentary based on historical data and analyst forecasts only using an unbiased methodology and our articles are not intended to be financial advice. It does not constitute a recommendation to buy or sell any stock, and does not take account of your objectives, or your financial situation. We aim to bring you long-term focused analysis driven by fundamental data. Note that our analysis may not factor in the latest price-sensitive company announcements or qualitative material. Simply Wall St has no position in any stocks mentioned.
Have feedback on this article? Concerned about the content? Get in touch with us directly. Alternatively, email editorial-team@simplywallst.com