
Radian Group (RDN) Could Be 70% Undervalued After Mortgage Insurance Update
Radian Group (RDN) came into focus after fresh data on its US mortgage insurance operations highlighted its role in managing mortgage credit risk for banks, credit unions, and other lending clients.
Recent trading has been choppy for Radian Group, with the share price down 9.7% over the past 90 days and 4.9% year to date, even after a strong 9.5% 7 day share price return and a 1 year total shareholder return of 4.0% that builds on solid 3 and 5 year gains.
Compare Radian Group's mortgage credit story with other financials by scanning a curated set of 31 resilient stocks with low risk scores that aim to balance return potential with resilience.
Radian Group now combines a resilient mortgage insurance franchise with a share price that has slipped in recent months. The real test is whether that recent wobble leaves the stock fairly valued or still mispriced.
Price-to-Earnings of 8.1x: Is it justified?
Radian Group looks inexpensive on headline metrics, with the stock at $34.17 and a P/E of 8.1x that screens as lower than its own fair P/E estimate and than peers.
The P/E ratio compares what investors are paying today for each dollar of current earnings. For a mortgage insurance specialist like Radian Group, that matters because earnings can vary with credit cycles, claim patterns, and underwriting discipline. The multiple often reflects how much confidence the market has in those profits continuing.
Radian Group is described as good value against an estimated fair P/E of 10.4x, which indicates investors are attaching a lower price tag than the level the fair ratio points to. It is also highlighted as trading at a lower valuation relative to peers and the wider diversified financials group, which may indicate the market is applying a discount despite forecasts that earnings are expected to grow 4.38% per year.
The relative picture becomes clearer when you look across the sector. Radian Group's 8.1x P/E is noted as lower than the peer average of 8.4x and below the US diversified financial industry average of 16.8x. This is strong comparative language for a valuation gap that the fair P/E of 10.4x suggests the market could move toward if sentiment shifts. Result: Price-to-Earnings of 8.1x (UNDERVALUED)
Explore the SWS fair ratio for Radian Group.
Still, the Radian Group story can be knocked off course if mortgage credit quality weakens or if housing activity slows, which could dampen new insurance volumes.
Find out about the key risks to this Radian Group narrative.
Another View on Radian Group’s Value
The P/E workup presents Radian Group as inexpensive, yet the SWS DCF model points to something much more extreme. With the shares at $34.17 and the DCF value at $112.69, the stock is flagged as heavily undervalued by future cash flow estimates. When the gap is this wide, which lens should investors place more weight on?
Look into how the SWS DCF model arrives at its fair value.
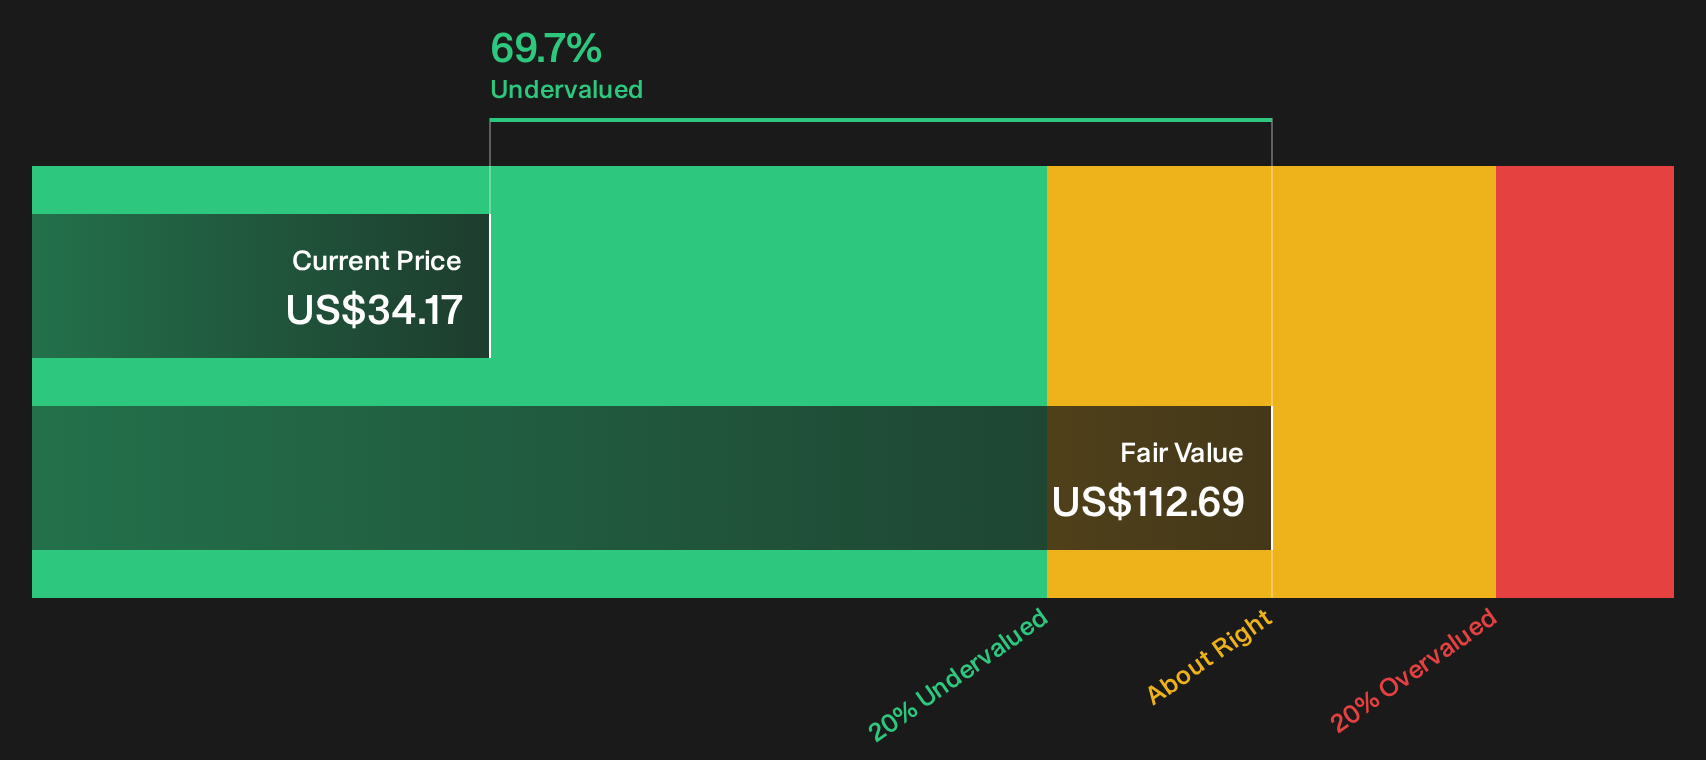
Simply Wall St performs a discounted cash flow (DCF) on every stock in the world every day (check out Radian Group for example). We show the entire calculation in full. You can track the result in your watchlist or portfolio and be alerted when this changes, or use our stock screener to discover 27 high quality undervalued stocks. If you save a screener we even alert you when new companies match - so you never miss a potential opportunity.
Next Steps
Big valuation gaps often polarise opinion, so this is the moment to look through the data yourself and decide where you land. To weigh both the potential upside and the key issues that keep investors cautious on Radian Group, take a close look at the 5 key rewards and 1 important warning sign
Looking for more investment ideas beyond Radian Group?
Radian Group gives useful context, but your next strong opportunity may sit elsewhere. Use curated screeners to widen your watchlist before the market prices them correctly.
- Target stronger balance sheets by reviewing the list of solid balance sheet and fundamentals (25 results) that combine financial resilience with room for potential upside.
- Hunt for value opportunities by scanning 27 high quality undervalued stocks that pair quality fundamentals with prices that may not fully reflect them yet.
- Prioritise cash returns by checking out the 8 dividend fortresses that focus on higher yields supported by underlying financial strength.
This article by Simply Wall St is general in nature. We provide commentary based on historical data and analyst forecasts only using an unbiased methodology and our articles are not intended to be financial advice. It does not constitute a recommendation to buy or sell any stock, and does not take account of your objectives, or your financial situation. We aim to bring you long-term focused analysis driven by fundamental data. Note that our analysis may not factor in the latest price-sensitive company announcements or qualitative material. Simply Wall St has no position in any stocks mentioned.
Have feedback on this article? Concerned about the content? Get in touch with us directly. Alternatively, email editorial-team@simplywallst.com