
Newmont (NEM) Rises With Gold Rally But Is The Bull Case Already Priced In
Newmont (NEM) is back on traders’ screens after its share price moved in step with a wider gold rally, as softer Federal Reserve rate hike expectations lifted bullion and drew capital toward gold producers.
For context, Newmont’s share price has pulled back over the past month, with a 30 day share price return of 9.08% in the red. However, the 90 day share price return of 21.26% and 1 year total shareholder return of 36.88% point to momentum that has been building over a longer stretch.
Spot similar momentum and macro-driven setups beyond Newmont by scanning our curated list of gold producers in the 35 elite gold producer stocks.The recent jump in Newmont on the back of the gold move leaves a practical question on timing. Is it worth stepping in after this run, or does patience for a cheaper entry make more sense once you look at valuation?
Most Popular Narrative: 16% Undervalued
Newmont’s most followed valuation storyline points to a fair value of $137.07 against a last close of $115.55, which frames the recent rally as part of a wider rerating rather than a short term spike.
The realization of synergies and increased production scale following the Newcrest Mining acquisition, together with ongoing asset optimization and the ramp-up of expansion projects (such as Ahafo North and Tanami), should support long-term revenue growth and cash flow stability.
Newmont's continued investment in ESG initiatives, such as decarbonization, water management, and tailings remediation, enhances its reputation and access to capital with institutional investors, protects margins against potential regulatory costs, and supports premium valuation multiples over the long run.
See why 164 investors see Newmont as 16% undervalued.
Result: Fair Value of $137.07 (UNDERVALUED)
Still, a few pressure points could flip this story fast, including lower grade output at key mines and higher sustaining capital that squeezes free cash flow.
Find out about the key risks to this Newmont narrative.
Another View: SWS DCF Says Newmont Is Priced Richer
The story shifts once you switch to the SWS DCF model. On this lens, Newmont at $115.55 screens as expensive against an estimated future cash flow value of $97.80, so the same cash generation profile that supports the narrative fair value also points to less room for error. Which version of “fair” are you more comfortable trusting?
To see how this cash flow view is built line by line, and how sensitive it is to small tweaks in growth or discount rates, Look into how the SWS DCF model arrives at its fair value.
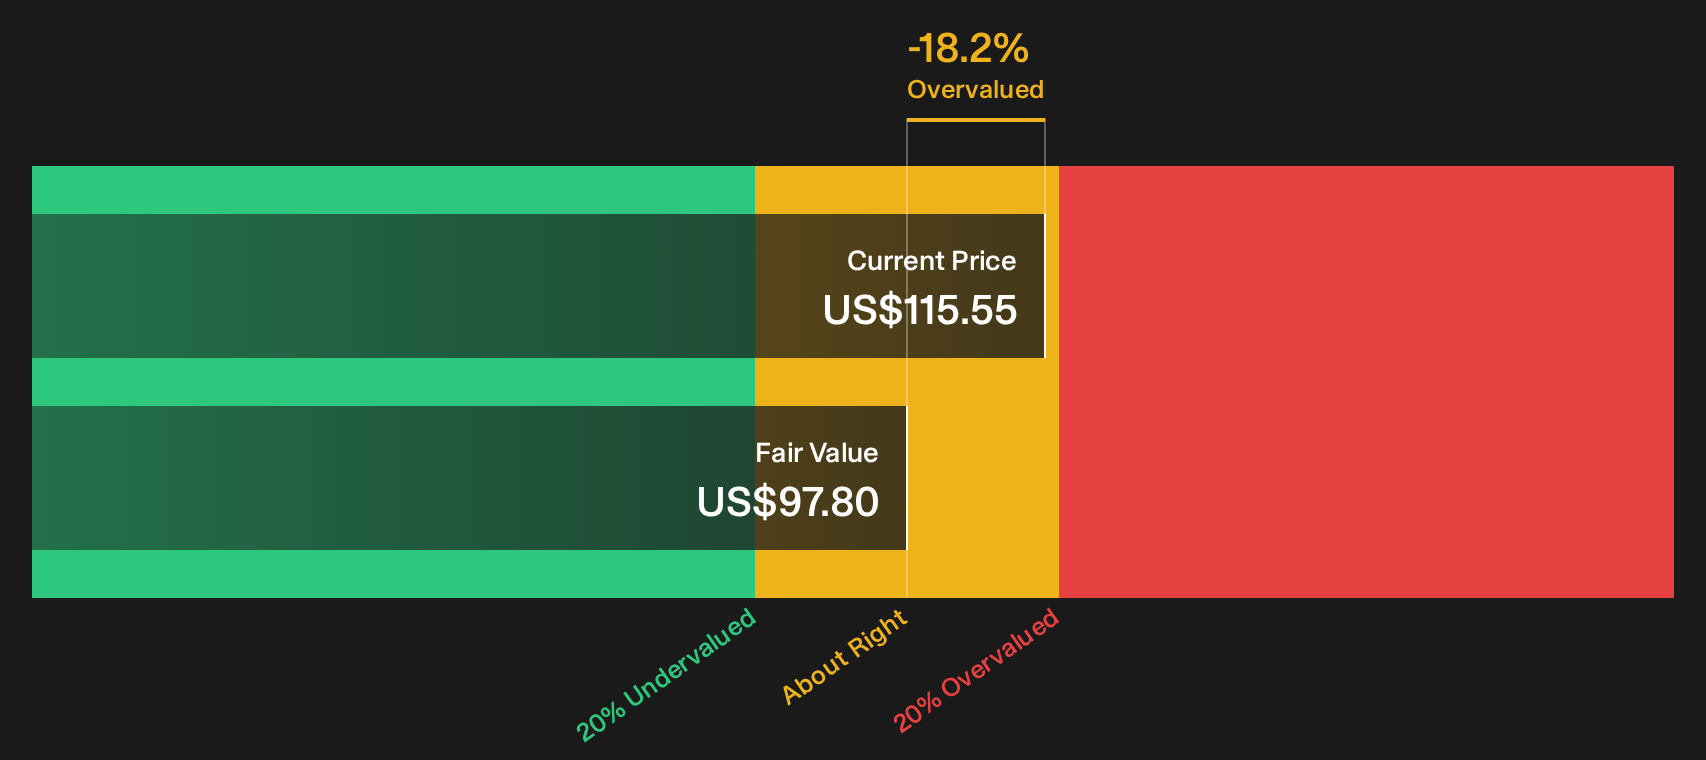
Simply Wall St performs a discounted cash flow (DCF) on every stock in the world every day (check out Newmont for example). We show the entire calculation in full. You can track the result in your watchlist or portfolio and be alerted when this changes, or use our stock screener to discover 27 high quality undervalued stocks. If you save a screener we even alert you when new companies match - so you never miss a potential opportunity.
Next Steps
Mixed signals like these can feel messy, so move quickly, stress test the numbers yourself, and weigh Newmont’s trade off between upside and risk using 4 key rewards and 1 important warning sign.
Looking for more ideas beyond Newmont?
If you stop with Newmont, you risk missing other setups that fit your style, time horizon, and risk tolerance. Put the same scrutiny to work across a wider watchlist.
- Target potential mispricing by filtering for strong businesses that still trade below intrinsic estimates through the 27 high quality undervalued stocks.
- Prioritize cash flow back to you by zeroing in on companies with robust payouts using the 8 dividend fortresses.
- Dial down portfolio volatility by focusing on sturdier balance sheets through the 31 resilient stocks with low risk scores.
This article by Simply Wall St is general in nature. We provide commentary based on historical data and analyst forecasts only using an unbiased methodology and our articles are not intended to be financial advice. It does not constitute a recommendation to buy or sell any stock, and does not take account of your objectives, or your financial situation. We aim to bring you long-term focused analysis driven by fundamental data. Note that our analysis may not factor in the latest price-sensitive company announcements or qualitative material. Simply Wall St has no position in any stocks mentioned.
Have feedback on this article? Concerned about the content? Get in touch with us directly. Alternatively, email editorial-team@simplywallst.com