
Texas Instruments (TXN), Why Is The Market Looking Closer Now?
Texas Instruments (TXN) is back in focus after a strong second quarter tied to higher chip pricing and growing AI demand, while rising Treasury yields and heavy factory investment keep debate over the stock’s valuation alive.
Texas Instruments shares have climbed strongly this year, with a year to date share price return of 62.35% and a 1 year total shareholder return of 65.21%. However, a 90 day share price decline of 7.47% hints at cooling near term momentum despite recent earnings and AI related headlines.
Scan how Texas Instruments compares with hand-picked peers riding similar AI and analog trends by reviewing the 91 AI infrastructure stocks in one place.
For Texas Instruments, the sharp year to date climb followed by a recent pullback leaves a simple tension: Are you seeing business strength or a mood swing in the share price?
Most Popular Narrative: 34% Undervalued
Texas Instruments last closed at $288.20, while the most followed valuation narrative pegs fair value at $435.69, which points to a wide gap that long term investors are watching closely.
Texas Instruments is in the midst of a multiyear capacity-expansion cycle that is temporarily suppressing free cash flow but materially enhancing the company’s long-term competitive position. The buildout of U.S.-based 300mm analog manufacturing is expected to structurally improve cost efficiency, support higher gross margins, and increase supply-chain resilience.
See why 20 investors see Texas Instruments as 34% undervalued.
Result: Fair Value of $435.69 (UNDERVALUED)
Still, Texas Instruments faces two clear pressure points that could challenge this upbeat narrative: higher factory spending that weighs on free cash flow, and any slowdown in AI related demand translating into weaker chip orders.
Find out about the key risks to this Texas Instruments narrative.
Another View On Texas Instruments Valuation
The popular narrative argues Texas Instruments is undervalued based on a $435.69 fair value, yet the SWS DCF model points the other way. On that framework, the future cash flow value lands at $238.88, below the recent $288.20 share price, which flags an overvalued signal instead.
This gap between story driven upside and cash flow based caution leaves a simple question for investors: Which risk matters more to you, overpaying on today’s fundamentals or missing out if the optimistic narrative proves right over time?
Look into how the SWS DCF model arrives at its fair value.
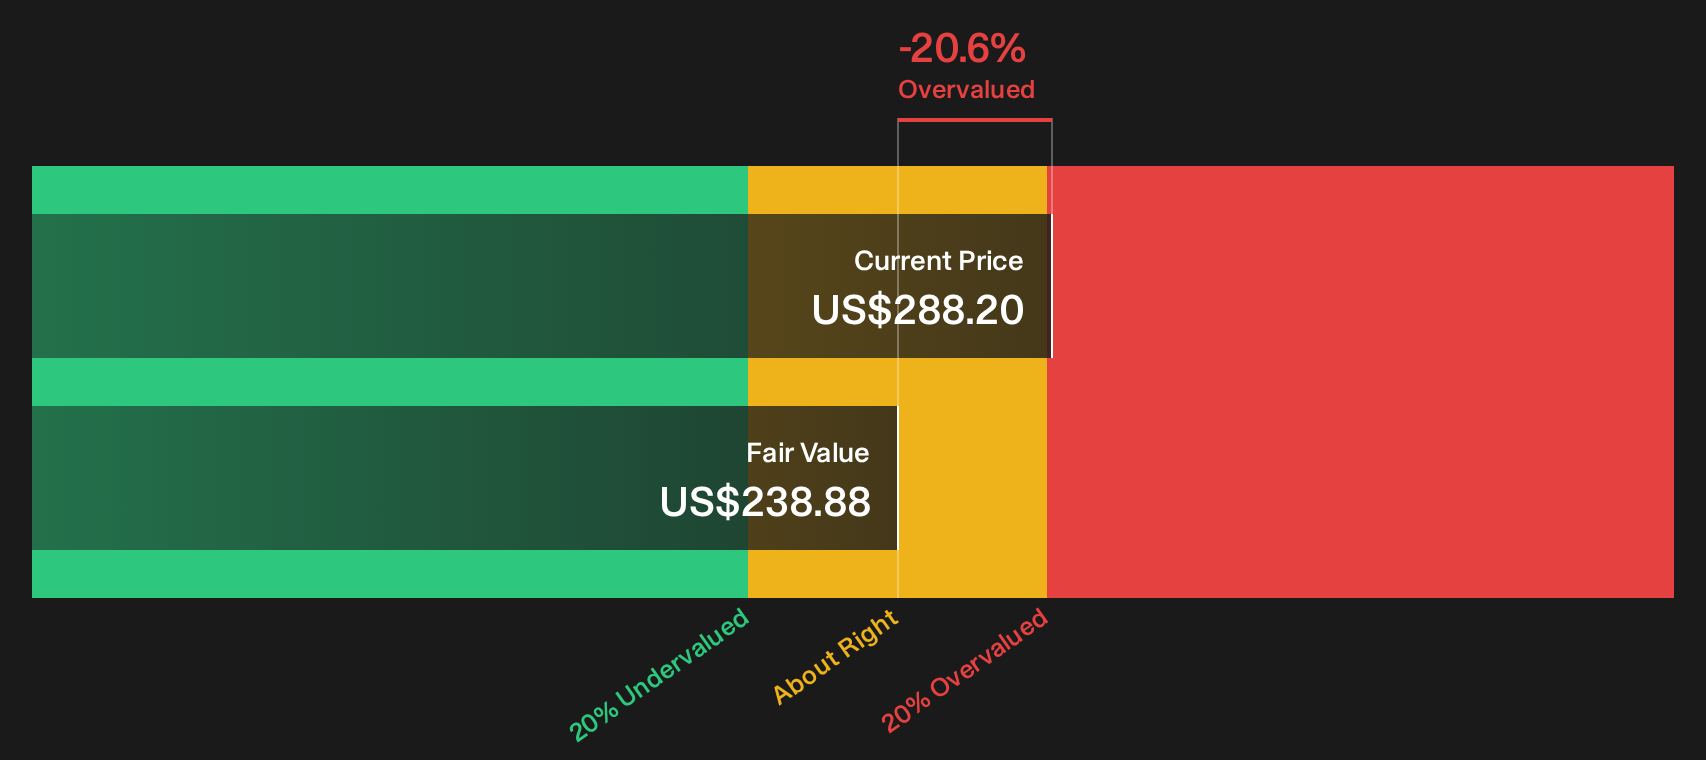
Simply Wall St performs a discounted cash flow (DCF) on every stock in the world every day (check out Texas Instruments for example). We show the entire calculation in full. You can track the result in your watchlist or portfolio and be alerted when this changes, or use our stock screener to discover 27 high quality undervalued stocks. If you save a screener we even alert you when new companies match - so you never miss a potential opportunity.
Next Steps
Sentiment around Texas Instruments is clearly split, with enthusiasm over rewards alongside debate about the risks. Move quickly, review the underlying numbers, and weigh both sides using the 2 key rewards and 2 important warning signs.
Looking for more Texas Instruments style investment ideas?
If you only watch Texas Instruments, you risk missing other companies that fit your goals. Use focused screeners to turn scattered watchlists into a sharper playbook.
- Target potential mispricings by scanning companies that currently screen as 27 high quality undervalued stocks.
- Prioritise resilience over drama by filtering for 31 resilient stocks with low risk scores that still offer meaningful upside potential.
- Get ahead of the crowd by reviewing a 20 high quality undiscovered gems before attention and valuations catch up.
This article by Simply Wall St is general in nature. We provide commentary based on historical data and analyst forecasts only using an unbiased methodology and our articles are not intended to be financial advice. It does not constitute a recommendation to buy or sell any stock, and does not take account of your objectives, or your financial situation. We aim to bring you long-term focused analysis driven by fundamental data. Note that our analysis may not factor in the latest price-sensitive company announcements or qualitative material. Simply Wall St has no position in any stocks mentioned.
Have feedback on this article? Concerned about the content? Get in touch with us directly. Alternatively, email editorial-team@simplywallst.com