
World Gold Council: In September, the global physical gold ETF inflow of about US$10 billion led Europe and North America
The Zhitong Finance App learned that according to the World Gold Association, in September, global physical gold ETFs flowed in about 10 billion US dollars, and gold ETFs in all regions achieved net inflows. Among them, Europe and North America lead the way. Although the decline in gold prices caused the total asset management scale (AUM) of global gold ETFs to drop 7% month-on-month to US$574 billion, strong demand still led to an increase in total global gold ETF holdings by 67 tons to 4,256 tons.
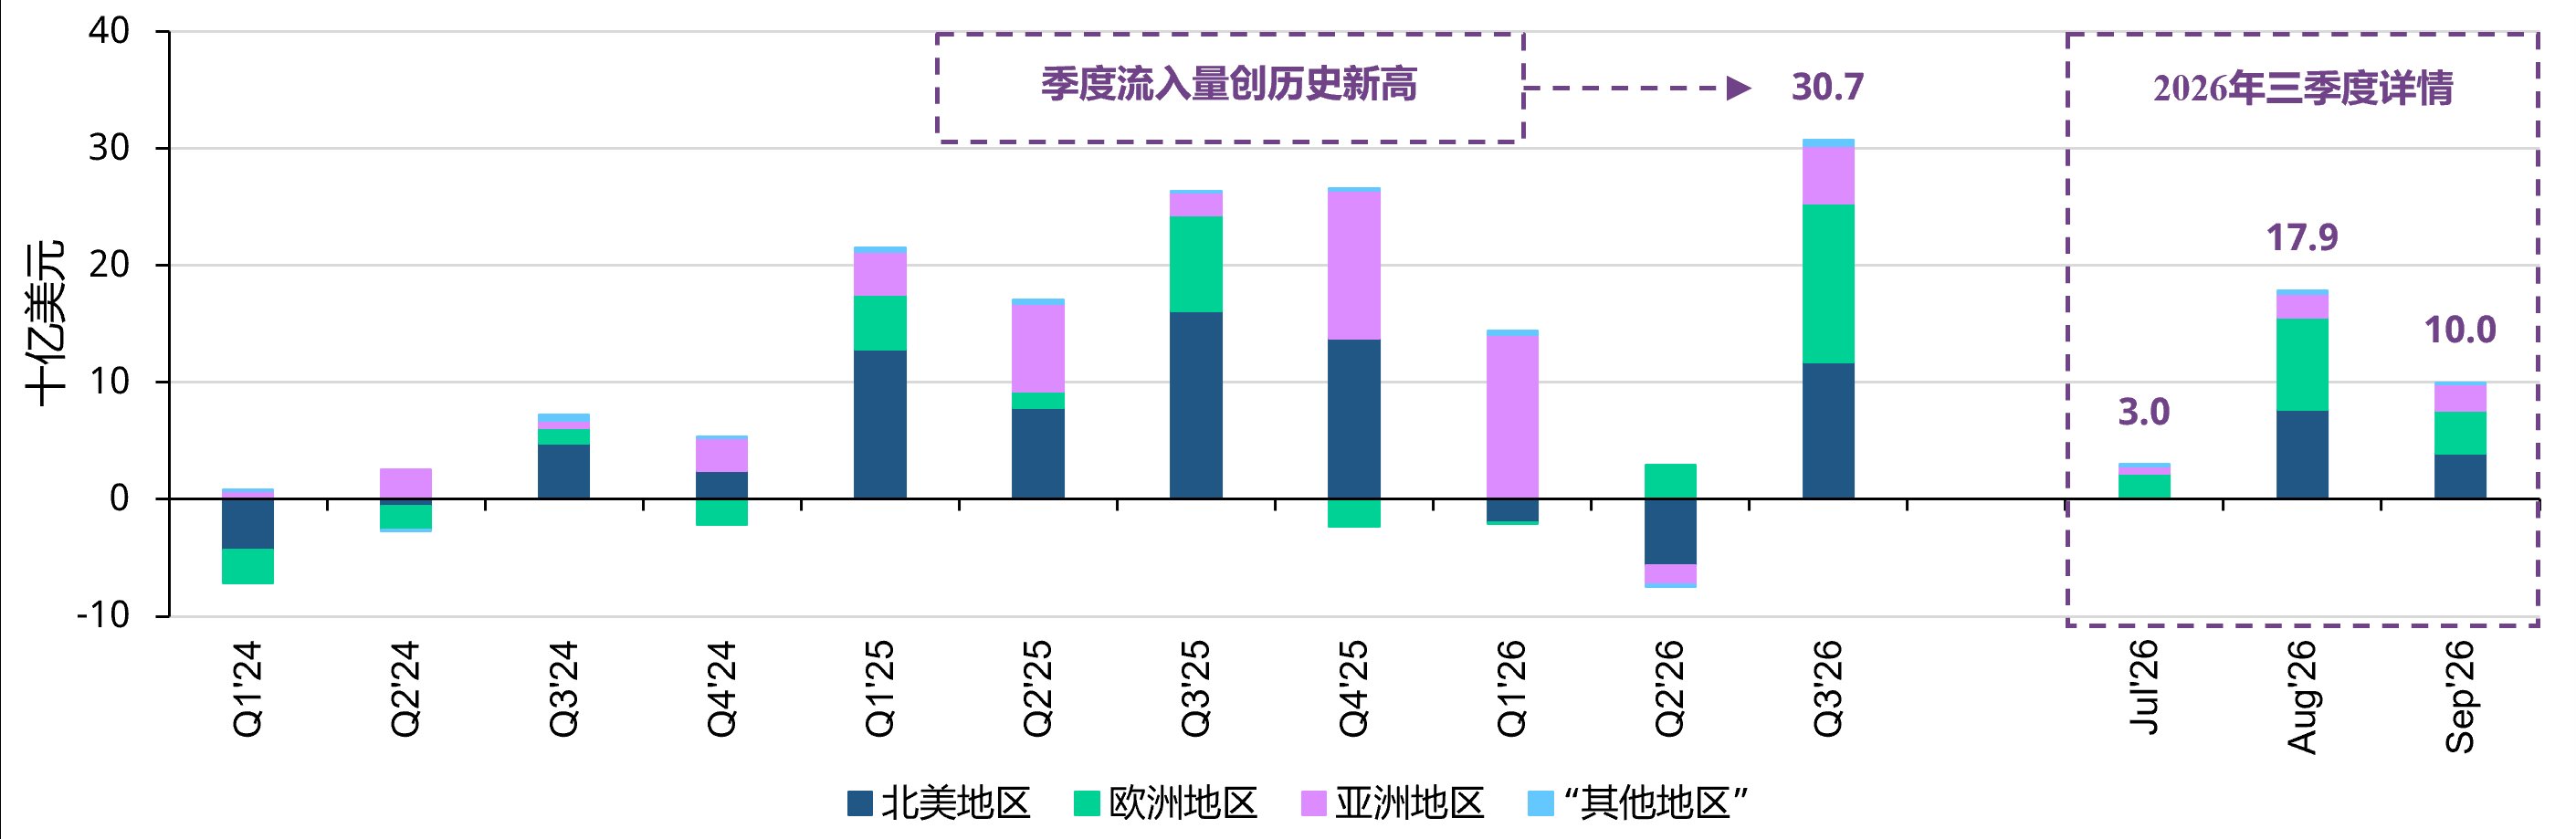
In the third quarter, global investors increased their total holdings of gold ETFs by about 31 billion US dollars. Total Asset Management (AUM) increased by 9%, and total holdings increased by 211 tons. The inflows recorded in this quarter were mainly dominated by the US, and the UK also contributed significantly. The scale of the first three quarters was slightly larger than China, and currently ranked first in the world.
North America
In September, gold ETF inflows to North America reached 4 billion US dollars, of which the US inflows reached 3.8 billion US dollars, while Canada was relatively moderate, with inflows of 206 million US dollars.
The September ETF inflow was achieved against the backdrop that the US domestic environment was unfavorable to gold:
The Federal Reserve raised interest rates by 25 basis points in September, and hinted that monetary policy may be further tightened in the future, driving up US Treasury yields and the US dollar. The above factors drive up the opportunity cost of holding gold and put pressure on the price of gold.
Despite this, continued inflation, high energy prices, and concerns about stock market valuations (especially AI-related sectors), compounded by increased volatility in the bond market, may have further strengthened the appeal of gold as a tool to diversify portfolios.
The continued inflow of gold ETFs also shows that some investors see this pullback in gold prices as an opportunity to establish or maintain strategic positions rather than a signal to reduce their exposure to positions.
In the third quarter, the total inflow of gold ETFs in North America rose to 12 billion US dollars. This is the first time since 2026 that the region experienced a net quarterly inflow. There was a clear reversal from the weak trend at the beginning of the year, causing the cumulative inflow in North America to rise to 4.1 billion US dollars from the beginning of the year to September.
European region
In September, European gold ETFs flowed in at 3.6 billion US dollars. The UK is still the largest contributor (2.2 billion US dollars). German and French gold ETFs have also had steady inflows. Swiss funds also achieved net inflows, but their holdings were reduced by 1 ton. This divergence between capital inflows and changes in positions is mainly related to the mechanism of foreign exchange hedging products.
The continued inflow of UK funds is particularly prominent: in the 13 weeks prior to September 25, inflows averaged 12 weeks, which is the strongest continuous inflow record since 2022, indicating that the interest of British investors in allocating gold is continuing and not driven only by a single event.
Recent inflows have coincided with rising maturity premiums on UK treasury bonds. This may reflect investors' concerns about inflationary uncertainty, fiscal sustainability, and broader risks in the sovereign bond market, and these factors may just reinforce the appeal of gold as a tool to diversify portfolios.
In the third quarter, total inflows to Europe reached a record of 14 billion US dollars, and ETF inflows to the UK market were about 7.5 billion US dollars, the strongest quarterly inflow performance in history. Europe also surpassed North America in terms of influx.
From the beginning of the year to September, the cumulative inflow of British funds was 9.5 billion US dollars, slightly surpassing Chinese gold, and temporarily ranked first in the world.
Asia region
In September, the Asian gold ETF inflow was about 2.3 billion US dollars, for the third month in a row. China is still leading the regional capital inflow. India, Japan, South Korea, and Singapore also recorded net inflows during the month, highlighting the wide range of regional buying coverage: despite weakening gold prices, Chinese funds continued to attract capital inflows. Thanks to another weakening of the domestic stock market and the decline in Chinese treasury yields, two factors combined to support the relative appeal of gold. India's fund inflows continued the previous trend, and may be supported by a correction in the domestic stock market, investors' opportunistic dips, and increased demand for diversified investment portfolios.
In the third quarter, the region's total inflow for the third quarter rose to US$4.9 billion.
Other regions
In September, gold ETFs from other regions poured in US$104 million, and Australian funds covered almost all of the month's purchases (US$106 million), completely offsetting the small outflow of capital from South Africa. This is also the third month in a row that the region has achieved net inflows.
In the third quarter, total inflows from other regions rose to US$476 million, setting a quarterly inflow record.
Trading volume remains stable
In September, the average daily trading volume of the global gold market fell slightly by 2% month-on-month to US$423 billion. The average daily trading volume of OTC transactions increased 1% to US$229 billion, and the average daily volume of LBMA increased by 1% month-on-month to US$200 billion. The average daily trading volume of the exchange fell 4% month-on-month to US$187 billion, mainly affected by the trading volume of the Shanghai Futures Exchange (down 11%). At the same time, COMEX trading volume declined slightly by 1%. The average daily trading volume of the global gold ETF market fell 19% month-on-month to US$7 billion, and trading volume declined in all regions.
In September, COMEX gold futures net long holdings fell 13% (down 100 tons) to 654 tons, and managed fund net long holdings decreased by 84 tons to 387 tons. The net long holdings of other reportable holdings also declined by 16 tons to 267 tons.
The net open positions for COMEX gold options fell back to the level of early August, but were still significantly higher than when gold prices hit a record high in January.
Spread positions also fell sharply in September (down 156 tons), reversing the sharp increase in August. The decline was almost entirely concentrated in other reportable positions. This change indicates that hedged futures positions have been significantly reduced, but its impact on the price of gold itself is currently unclear.