
As the US stock bull market is about to reach its fourth year, how long can the S&P 500's “AI addiction” last?
The Zhitong Finance App learned that the bull market in the US stock market showed almost no signs of pressure as it approached its fourth anniversary: corporate profits were rock-solid, the S&P 500 index was approaching an all-time high, and the volatility seemed moderate.
However, under the surface, questions continue to accumulate about what might end this round of the market, which began on October 12, 2022 and has already increased by 117%. Although there is no single answer, one major point of contention that is becoming increasingly prominent is that stock indexes are trading at historically high levels, while many individual stocks have performed poorly, and there is a huge divergence between the two.
Compiled data shows that since October 2022, the equal-weighted S&P 500 index, which excludes market capitalization weighting effects, has lagged 52 percentage points behind the benchmark stock index. This is the most extreme gap in strength and weakness that occurred when the bull market reached this stage since at least the 1990s.
Ned Davis Research (NDR) also reported before the S&P 500 reached a record high on Tuesday, indicating that in the week of September 21, less than 25% of constituent stocks traded above its 50-day moving average, and the proportion of individual stocks trading above the 200-day moving average also fell below 45%. NDR characterized this combination of “the index nearing historic high and extreme deterioration in market breadth” as the worst breadth reading on record.
What is also alarming is that the simultaneous occurrence of the three conditions — less than 35% of stocks are above the 50-day EMA, less than 50% of stocks are above the 200-day EMA, and the S&P 500 index is within 3% of its all-time high — only six times since 1980. However, after similar signals appeared several times before, the market all reached a phased peak within about five months.
Ed Clissold, chief US strategist at NDR, and Thanh Nguyen, a senior analyst, made it clear: “The vast majority of markets were accompanied by market breadth differentiation before they appeared at the top. We are taking this technical warning sign seriously.”
“This bull market will continue — but what I'm worried about is that compared to history, the breadth of this round of growth is too narrow,” said Sam Stovall, chief investment strategist at the CFRA. “Someday this round will come to an end, but everything will depend on the profit growth and outlook of US companies.”
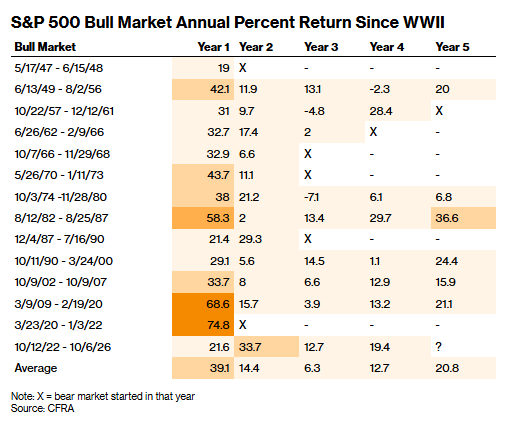
According to CFRA data dating back to 1947, the S&P 500 index has risen 117% since 2022, ranking third in the four-year bull market. The data showed that when the rise continued into the fifth year, the average increase was 21%. In theory, this means there is room for the market to spread outward from tech giants — these tech giants have contributed most of the increase since October 2022.
Concentration itself is not a problem; when profits are also highly concentrated, this pattern is reasonable — the top ten companies contributed about one-third of the index's profits, roughly in sync with the trend of market capitalization concentration over the past ten years. The risk, however, is that when valuations have been “priced to perfection,” and any shift in market sentiment could trigger a chain sell-off of concentrated positions, the fragility of the portfolio will far exceed investors' expectations.
The core narrative of this bull market is undoubtedly artificial intelligence. Since US stocks bottomed out at the end of 2022, the AI boom has increased the S&P 500's market capitalization (AI) by nearly $40 trillion. As an iconic company in the AI market, chipmaker Nvidia (NVDA.US) has soared more than 1900% since US stocks bottomed out at the end of 2022, and is about to become the first company with a market capitalization of 6 trillion US dollars.
However, the stock market is highly bound to AI optimism, and once the trend reverses, this pattern is prone to sharp fluctuations. It remains unknown when — and if — Wall Street will reap the rewards of the billions of dollars invested in AI infrastructure.
According to UBS estimates, the capital expenditure of global hyperscale manufacturers will rise from about 1 trillion US dollars in 2026 to about 1.45 trillion US dollars in 2027, and will cumulatively reach about 4.1 trillion US dollars from 2026 to 2028. However, revenue delivery is seriously lagging behind — according to IDC forecasts, the global generative AI market will be close to $150 billion in 2027, and there is still a huge gap compared to trillion-dollar capital expenditure. FactSet data shows that the incremental debt of hyperscale manufacturers as a share of capital expenditure has risen from 9% in the 2024 fiscal year to 32% in 2026, and the free cash flow of the five largest hyperscale manufacturers is close to zero or negative in 2026.
In addition to this, another special feature of this bull market is its misalignment with the monetary policy cycle. Jurrien Timmer, head of global macro at Fidelity Investments, said that traditional bull markets usually show general upward characteristics in the first few years because the Federal Reserve cuts interest rates to support the economy. But this time the opposite is true: the Federal Reserve raised interest rates in 2022 to curb inflation, putting pressure on the stock market and forcing companies to lower profit expectations after the most aggressive monetary tightening in decades.
Under the intertwining of many risk factors, continued strong corporate profits form the core support of the current bull market. Today, American companies are experiencing one of the strongest profit cycles in modern history, and the S&P 500 index has achieved seven consecutive quarters of double-digit profit growth. Investors expect this trend to continue.
“As long as companies continue to deliver good results, investors will continue to ignore most of these risks,” Timmer said, “but once there are any signs of weakness, the market will review valuation levels.”
The third quarter earnings season will begin next Tuesday, and large banks such as J.P. Morgan Chase (JPM.US) will be the first to announce results. This will be a major test for the stock market. Subsequently, the November US midterm elections may cause fluctuations in the short term. And the Federal Reserve's interest rate path remains a major variable in the outlook.
Despite all these risks, the S&P 500 is currently not far from 8,000 points. Ed Yardeni, a long-term bullish watcher and president of Yardeni Research, predicts that the S&P 500 index will reach 10,000 points by the end of this decade, supported by strong corporate profits and a sound economy. However, he lowered the S&P 500 year-end target from 8,400 points to 7,900 points last month, saying that the risk of an economic downturn in the next three to six months has increased.
So what's the problem? Higher yields are a major headwind. The 10-year US Treasury yield rose to 5.34% last week, for the first time since 2002, and had a serious impact on everything from small capitalization stocks that are sensitive to interest rates to banks to more speculative corners of the market — such as unprofitable technology companies and companies with the weakest balance sheets.
Another reason for bulls to be optimistic is the resilience of the economy, and investors are relieved of concerns about the recession, which helped the valuation to recover after 2022. The Atlanta Federal Reserve's GDPNow model predicts that real GDP will grow at an annual rate of 3.7% in the third quarter, up from 2.2% in the second quarter.
Because of this, Melody Global Managing Director and Chief Investment Officer Seth Merrill believes that this round of gradual interest rate hikes by the Federal Reserve may create conditions for market rotation and more sectors to take over the lead.
“In my portfolio, assets other than giant tech stocks have had mediocre returns and even poor performance,” Merrill said. “But at the index level, you can't see this at all.”