
Community Financial System (CBU) Could Be 41% Undervalued On A Recent Pullback
Community Financial System (CBU) has drawn fresh attention after recent trading left the stock down about 6% over the past month and roughly 12% over the past 3 months.
Set against a 1-year total shareholder return of 6.92% and a 3-year total shareholder return of 55.94%, the recent 30-day share price decline of 6.41% and 90-day drop of 11.50% suggests momentum in Community Financial System is fading, even as long-term holders remain ahead.
Scan other regional banking stocks showing similar momentum shifts with a curated list of 31 resilient stocks with low risk scores designed to pair steadier risk profiles with more resilient return paths.
Community Financial System now pairs long term shareholder gains with a recent pullback that has reset expectations. The business looks solid. The live question is whether the current share price reflects that strength or overstates it.
Preferred P/E of 13.6x for Community Financial System: Is it justified?
On current figures, Community Financial System trades on a P/E of 13.6x, which leaves the stock slightly cheaper than its direct peers but richer than the broader US banks group.
The P/E ratio compares the share price to earnings per share. For a lender like Community Financial System, it is a shorthand for what investors are willing to pay for each dollar of profit, and it often reflects views on earnings quality, growth durability, and risk in the loan book.
Against a peer average of 14.6x, Community Financial System screens as better value on this measure. This suggests the market is not assigning a premium despite factors such as high quality earnings, improved net profit margins at 27.3%, and consistent profit growth of 3.5% per year over the past 5 years.
That relative discount flips when you compare the same 13.6x P/E with the wider US banks industry at 11.4x. On that yardstick, the stock trades at a clear premium. It also sits above an estimated fair P/E of 12.7x, meaning the market is paying more than the level the fair ratio model indicates it could move toward if sentiment cooled.
Explore the SWS fair ratio for Community Financial System.
Result: Price-to-earnings of 13.6x (ABOUT RIGHT)
Still, the Community Financial System story could be knocked off course if credit quality weakens or if higher funding costs squeeze those 27.3% net profit margins.
Find out about the key risks to this Community Financial System narrative.
Another View on Community Financial System's Value
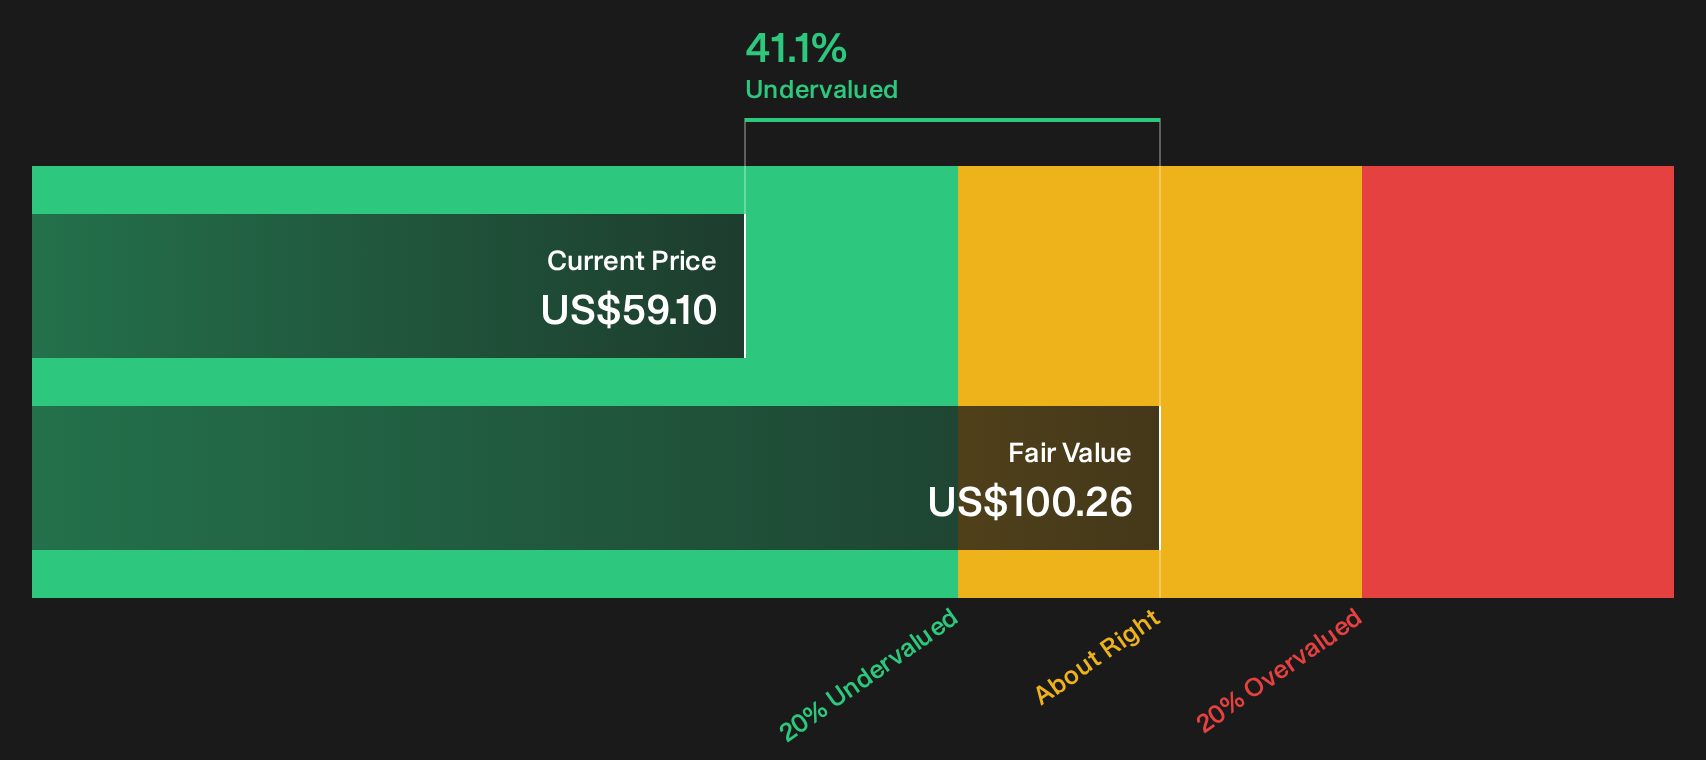
On earnings multiples, Community Financial System looks roughly in line with fair value. A different lens tells a very different story. The SWS DCF model values the future cash flows at $100.26 per share, compared with the current price of $59.10, which implies the stock trades at a 41.1% discount. That split raises a simple question: Are investors underestimating the cash generation or is the model too optimistic about the road ahead?
For anyone weighing how much weight to give that cash flow view versus the P/E, it helps to understand exactly how the model works and what assumptions sit underneath it. Look into how the SWS DCF model arrives at its fair value.
Simply Wall St performs a discounted cash flow (DCF) on every stock in the world every day (check out Community Financial System for example). We show the entire calculation in full. You can track the result in your watchlist or portfolio and be alerted when this changes, or use our stock screener to discover 27 high quality undervalued stocks. If you save a screener we even alert you when new companies match - so you never miss a potential opportunity.
Next Steps
Sentiment around Community Financial System is mixed, which makes this a useful moment to test the numbers yourself instead of following the crowd. If you want a quick snapshot of what the upside-focused investors are seeing, review the 4 key rewards
Want more ideas beyond Community Financial System?
If Community Financial System has sharpened your thinking, do not stop here. Fresh opportunities often sit just outside the stocks already on your radar.
- Target resilient balance sheets and steadier risk profiles by scanning companies in the list of solid balance sheet and fundamentals (25 results) so you are not relying on one bank to carry your portfolio.
- Hunt for mispriced opportunities with the 27 high quality undervalued stocks and see which businesses combine compressed valuations with underlying fundamentals that still look intact.
- Build a smoother income stream by reviewing the 8 dividend fortresses and weighing which cash generators could complement or offset your exposure to Community Financial System.
This article by Simply Wall St is general in nature. We provide commentary based on historical data and analyst forecasts only using an unbiased methodology and our articles are not intended to be financial advice. It does not constitute a recommendation to buy or sell any stock, and does not take account of your objectives, or your financial situation. We aim to bring you long-term focused analysis driven by fundamental data. Note that our analysis may not factor in the latest price-sensitive company announcements or qualitative material. Simply Wall St has no position in any stocks mentioned.
Have feedback on this article? Concerned about the content? Get in touch with us directly. Alternatively, email editorial-team@simplywallst.com