
Shionogi (TSE:4507) Weighs IntraBio Deal, Is The Stock Undervalued?
Shionogi (TSE:4507) moved into focus after its board met on 5 October 2026 to review an agreement for Shionogi Inc. to acquire rare disease specialist IntraBio, including AQNEURSA for neurodegenerative conditions.
That proposed IntraBio acquisition lands at a moment when Shionogi’s momentum has cooled in the near term, with the share price drifting down over the past month and quarter. Even so, the 1-year total shareholder return of 13.2% and 3-year total shareholder return of 30.6% still point to a stronger longer-run journey for investors.
Scan beyond Shionogi and this IntraBio deal by checking a curated group of healthcare peers with resilient balance sheets using our list of solid balance sheet and fundamentals (23 results).
Recent share weakness and the IntraBio move now pull Shionogi into a clear fork in the road. Is most of the re-rating already behind the stock, or is the stronger upside case still ahead on today’s valuation?
Preferred Multiple of P/E 8.9x: Is it justified?
On simple valuation math, Shionogi trades on a P/E of 8.9x, which looks restrained next to both its own earnings profile and the wider pharmaceuticals peer set.
The P/E ratio links the current share price to trailing earnings per share, so for a pharma group like Shionogi it effectively tells you how much investors are willing to pay today for the profit stream produced by marketed drugs and the broader pipeline. In sectors where cash flows can stretch over long product cycles, this yardstick becomes a quick way to compare how the market is weighing those profit streams across different businesses.
Here, the current P/E of 8.9x sits well below the JP Pharmaceuticals industry average of 13.8x and the peer average of 17.5x. This indicates that the market is pricing Shionogi’s earnings at a clear discount. That gap also looks wide when set against the estimated fair P/E of 20x. This is a level the market could move toward if sentiment on the earnings outlook or balance of risks shifted in Shionogi’s favor.
Explore the SWS fair ratio for Shionogi.
Result: Price-to-Earnings of 8.9x (UNDERVALUED)
Still, that discount can quickly look fragile if Shionogi’s net income contraction of 3.5% a year persists, or if the IntraBio acquisition integration proves slower and costlier than hoped.
Find out about the key risks to this Shionogi narrative.
Another View: What The SWS DCF Model Says About Shionogi
The earnings multiple points one way, but the SWS DCF model points even further. On this approach, Shionogi at ¥2,744.5 is compared against an estimated future cash flow value of ¥7,353.15, which also indicates the shares are undervalued and suggests the gap in expectations is wide.
DCF relies on long term cash flow assumptions rather than today’s earnings. This result raises a simple question for investors: Is the market overly cautious on Shionogi’s future profit path, or are these cash flow projections too generous?
Look into how the SWS DCF model arrives at its fair value.
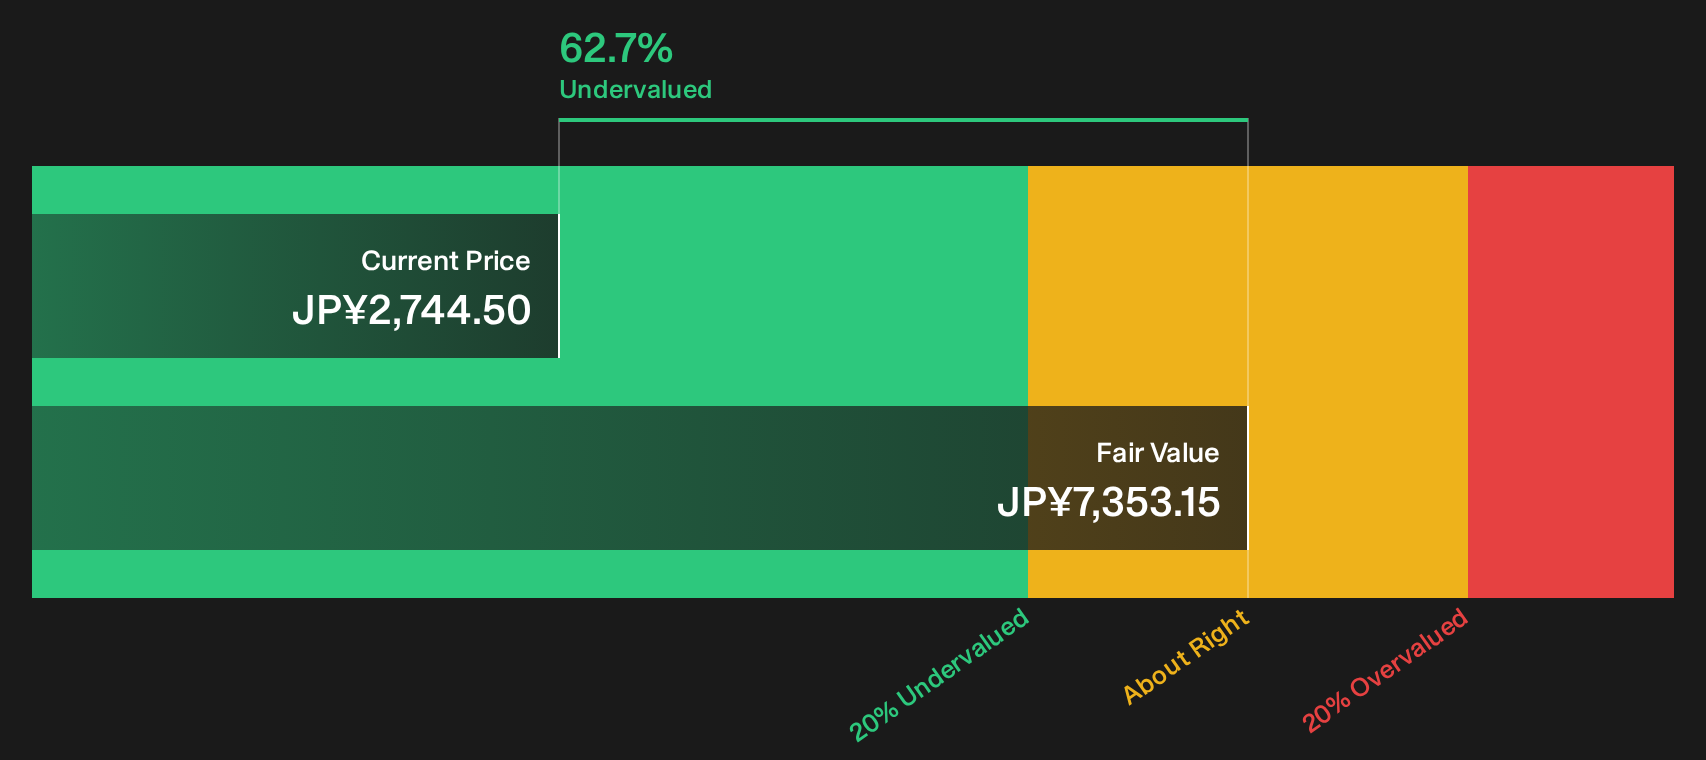
Simply Wall St performs a discounted cash flow (DCF) on every stock in the world every day (check out Shionogi for example). We show the entire calculation in full. You can track the result in your watchlist or portfolio and be alerted when this changes, or use our stock screener to discover 12 high quality undervalued stocks. If you save a screener we even alert you when new companies match - so you never miss a potential opportunity.
Next Steps
Curious whether Shionogi’s risk reward trade off really suits you? Act while the market is still weighing both sides and walk through the 5 key rewards and 2 important warning signs.
Looking for more investment ideas beyond Shionogi?
If Shionogi has sharpened your focus on valuation and risk, do not stop here. Broaden your watchlist and pressure test your thinking with more targeted opportunities.
- Target potential mispriced opportunities by scanning a curated set of strong fundamentals and mellow valuations through the 12 high quality undervalued stocks.
- Strengthen the income side of your portfolio by reviewing companies in the 28 dividend fortresses that pair higher yields with established payout records.
- Reduce unpleasant surprises by filtering for resilient businesses in the 23 resilient stocks with low risk scores before capital rushes toward the same ideas.
This article by Simply Wall St is general in nature. We provide commentary based on historical data and analyst forecasts only using an unbiased methodology and our articles are not intended to be financial advice. It does not constitute a recommendation to buy or sell any stock, and does not take account of your objectives, or your financial situation. We aim to bring you long-term focused analysis driven by fundamental data. Note that our analysis may not factor in the latest price-sensitive company announcements or qualitative material. Simply Wall St has no position in any stocks mentioned.
Have feedback on this article? Concerned about the content? Get in touch with us directly. Alternatively, email editorial-team@simplywallst.com