
Iron Mountain (IRM) Dropped, So What Is Driving Attention Now?
Iron Mountain (IRM) shares pulled back about 2.4% at the last close to US$112.97, drawing fresh attention to how the information management and data center specialist has been pricing its growth story.
That 1 day share price decline of 2.4% comes after a mixed stretch for Iron Mountain, with the 7 day share price return up 1.66%, the 30 day move down 2.68%, and the 90 day share price performance down 7.03%. This comes as momentum cools following a strong year to date share price gain of 35.72%, set against an 11.26% 1 year total shareholder return and a much stronger multi year total shareholder return profile over 3 and 5 years.
Scan how Iron Mountain’s pullback compares to peers in similar cash-generative, asset-heavy plays by reviewing the hand picked list of solid balance sheet and fundamentals (25 results).
So is Iron Mountain’s recent slip a sign that investors are cooling on the story, or is sentiment simply drifting away from a business that still looks similar on the fundamentals we can measure today?
Most Popular Narrative: 22% Undervalued
Iron Mountain’s most followed narrative pegs fair value at about $144.91 using an 8.4% discount rate. This sits well above the latest $112.97 close and puts the recent pullback in a different light for anyone focused on long term cash flows.
Use of cash flow from the physical records management business, which management describes as highly cash generative with stable to slightly rising volumes and consistent pricing, together with net lease adjusted leverage of about 4.8x and a US$1.5b senior notes issue maturing in 2035, underpins continued funding of growth projects in data centers, ALM and digital without relying on equity issuance. This can support future AFFO per share and dividend capacity.
See why 48 investors see Iron Mountain as 22% undervalued.
Result: Fair Value of $144.91 (UNDERVALUED)
Still, the Iron Mountain story depends on the physical records arm remaining reliably cash generative and on large data center builds avoiding power, equipment, or leasing setbacks.
Find out about the key risks to this Iron Mountain narrative.
Another View On Iron Mountain’s Valuation
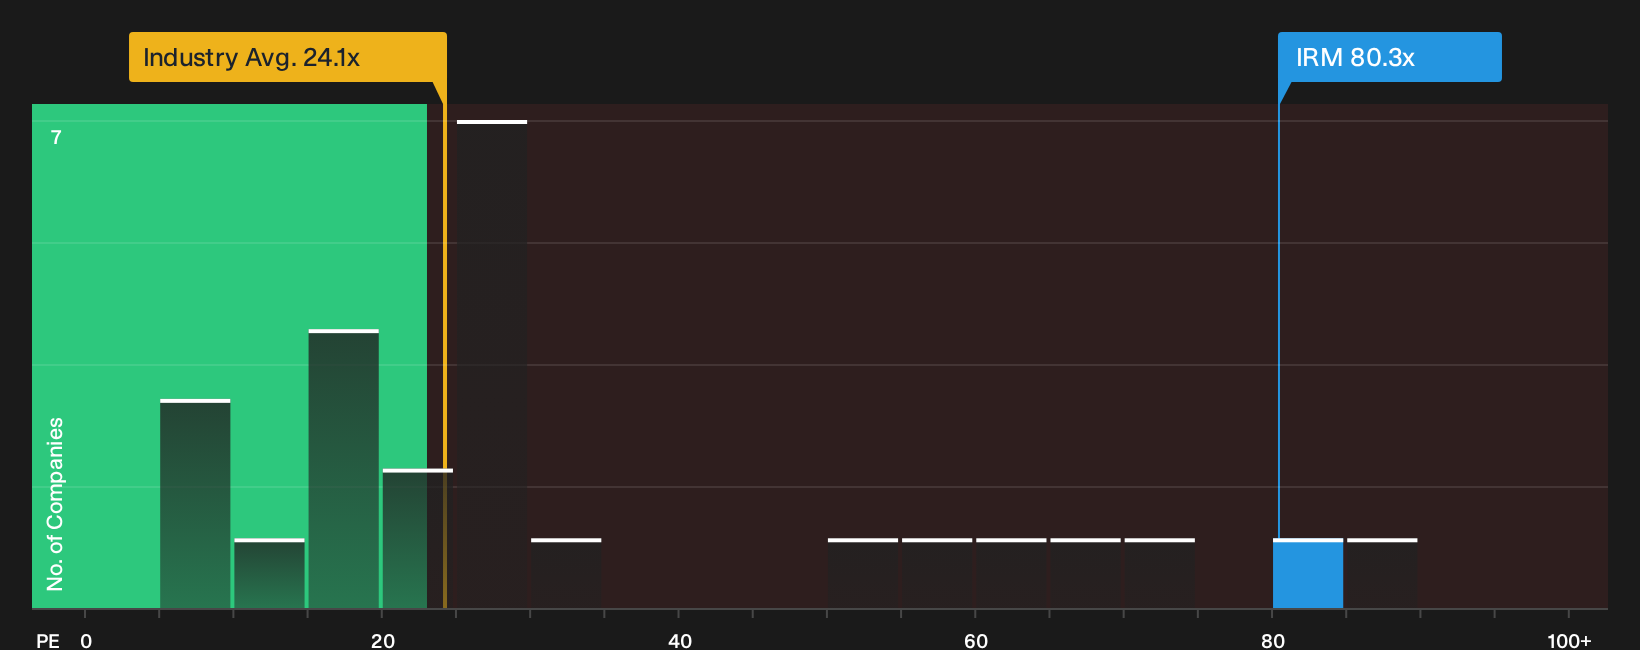
There is a catch. Iron Mountain trades on a P/E of 80.3x, while the North American Specialized REITs group sits around 23.9x and peers average 17.2x. The fair ratio is 41.9x. That gap points to real valuation risk if sentiment ever cools. Which lens do you trust more?
To see how this price tag lines up with the underlying numbers, take a closer look at our valuation breakdown, starting with the See what the numbers say about this price — find out in our valuation breakdown..
For a clearer sense of how this high earnings multiple compares with sector norms, review the
Next Steps
If this mix of enthusiasm and caution feels familiar, treat it as a cue to move quickly, review the underlying data yourself, and weigh both the 4 key rewards and 4 important warning signs.
Looking for more investment ideas beyond Iron Mountain?
If Iron Mountain has you thinking harder about valuation and risk, do not stop here. Broaden your watchlist now so you are not reacting after the next move.
- Target resilient balance sheets and steady fundamentals by scanning the list of solid balance sheet and fundamentals (25 results), which filters for financial strength first.
- Hunt for quality at a discount with the 27 high quality undervalued stocks, which highlights companies combining solid cash flows with room for potential repricing.
- Build an income focused shortlist using the 8 dividend fortresses to zero in on higher yielding payers with more robust profiles.
This article by Simply Wall St is general in nature. We provide commentary based on historical data and analyst forecasts only using an unbiased methodology and our articles are not intended to be financial advice. It does not constitute a recommendation to buy or sell any stock, and does not take account of your objectives, or your financial situation. We aim to bring you long-term focused analysis driven by fundamental data. Note that our analysis may not factor in the latest price-sensitive company announcements or qualitative material. Simply Wall St has no position in any stocks mentioned.
Have feedback on this article? Concerned about the content? Get in touch with us directly. Alternatively, email editorial-team@simplywallst.com