
American Airlines (AAL) Stock Looks Undervalued On Its 36% Five Year Fall
American Airlines Group has seen a mixed share price record in recent years, and that uneven path puts fresh attention on whether the current market value lines up with the revenue the airline is generating. With the stock still trading well below long term highs, the question on the table is how well its sales base supports today's price.
- Over the past 5 years the share price has fallen 36.1%, which keeps the focus squarely on whether investors are now paying a sensible multiple of American Airlines Group's sales.
- Approval in Brazil for American Airlines Group's planned US$100 million investment in Azul can shape expectations for future route breadth and ticket revenue, as the partnership may influence how effectively each seat sold converts into sales and cash.
- Your read on American Airlines Group is one view; the desks covering it have another. See what analysts think American Airlines Group's shares could be worth.
The issue now is whether American Airlines Group's current share price is appropriately supported by its sales when set against the Fair Ratio benchmark.
If you are considering whether American Airlines Group's share price aligns with its sales, it can be helpful to compare that view with a broader list of 28 high quality undervalued stocks
Does American Airlines Group Look Undervalued on Sales?
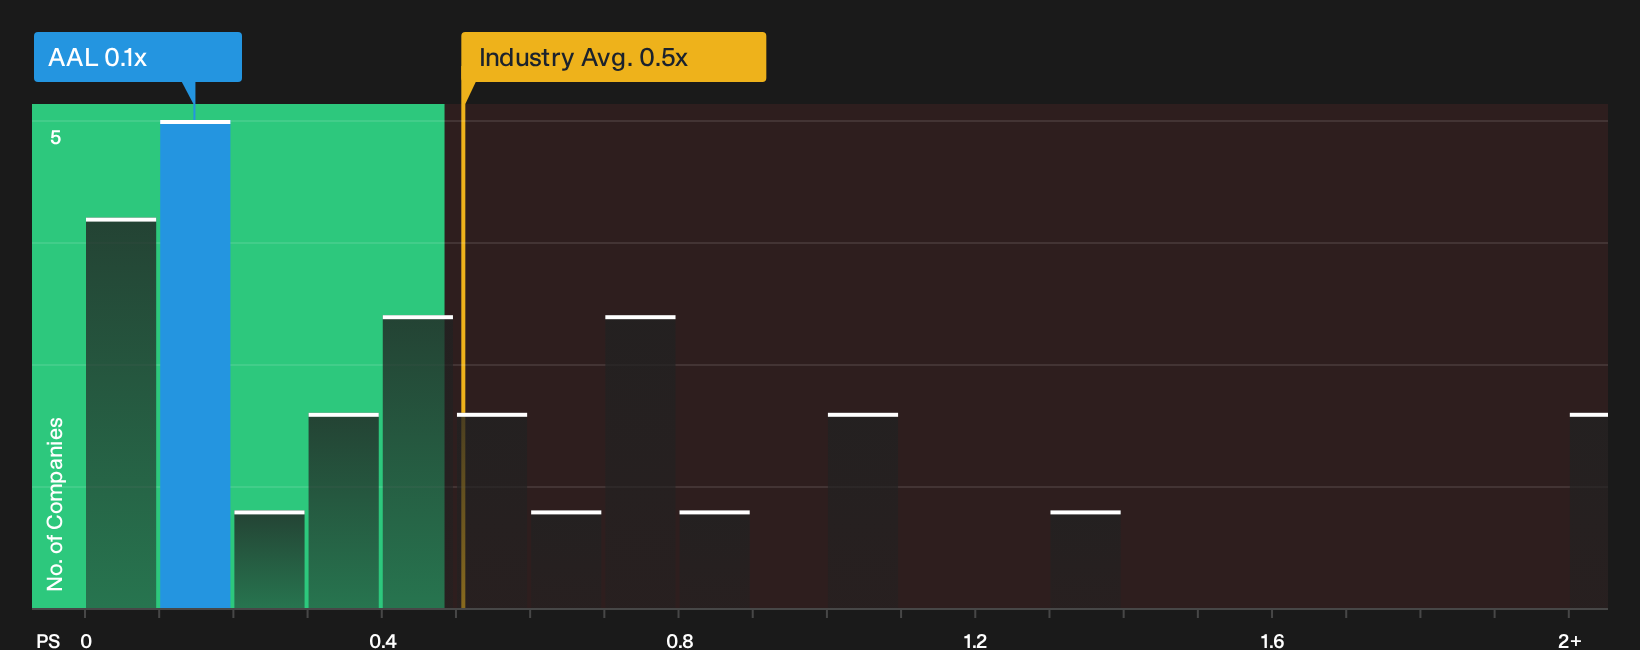
P/S is a useful lens for American Airlines Group because investors often anchor airline valuations to revenue capacity rather than accounting earnings. On this measure, the stock trades on a P/S of 0.1x, which is well below the Airlines industry average of 0.5x and also below the peer group at 0.8x. Because regulators in Brazil have now cleared the Azul investment, sentiment around future commercial ties has a tangible catalyst, yet the revenue multiple still prices American Airlines Group at a discount to these broad benchmarks.
The Fair Ratio framework, which blends the company’s growth profile, profitability, size and risk into a tailored benchmark, points to the current 0.1x P/S sitting below where you might normally expect the shares to trade. For an investor evaluating this, the key question is whether the risks that helped pull the multiple down are already reflected enough in the price, or whether the discount simply mirrors ongoing concerns about the quality and resilience of American Airlines Group's sales base. Explore the numbers behind American Airlines Group's P/S valuation.
The American Airlines Group Narrative: What Would Justify Today's Price?
Narratives for American Airlines Group pick up where this valuation question leaves off and spell out which future paths for growth, margins and earnings would need to play out for the stock to be worth meaningfully more or less than today’s price. Each narrative links its implied number to a clear view on how American Airlines Group's revenue profile, profitability and risks could evolve, giving you a reference point you can revisit as fresh information comes through.
Community views on American Airlines Group are split between those who see a discounted travel recovery story and those who focus on costs and balance sheet risk.
Bull case: 24% undervalued
"The significant growth in engaged AAdvantage loyalty program members and the new 10-year Citi card agreement, launching in 2026, provide structural tailwinds..."
Discover why this Narrative puts American Airlines Group at 24% undervalued.
Bear case: 24% overvalued
"Substantial capital expenditures will persist for fleet modernization, as American's delivery schedule for new aircraft remains high for the rest of the decade..."
Explore why this Narrative puts American Airlines Group at 24% overvalued.
Before acting on American Airlines Group's valuation, there is one more piece to check
The share price and revenue story only go so far when the people charting American Airlines Group's course, and how they are rewarded, have not been assessed here. See who runs American Airlines Group and how they are paid.
This article by Simply Wall St is general in nature. We provide commentary based on historical data and analyst forecasts only using an unbiased methodology and our articles are not intended to be financial advice. It does not constitute a recommendation to buy or sell any stock, and does not take account of your objectives, or your financial situation. We aim to bring you long-term focused analysis driven by fundamental data. Note that our analysis may not factor in the latest price-sensitive company announcements or qualitative material. Simply Wall St has no position in any stocks mentioned.
Have feedback on this article? Concerned about the content? Get in touch with us directly. Alternatively, email editorial-team@simplywallst.com