
7% Undervalued Could LTC Properties (LTC) Look Cheap As It Reaffirms Its Dividend
LTC Properties (LTC) has reaffirmed its monthly cash dividend, setting a fourth quarter payout of US$0.19 per common share, with payments scheduled for October 30, November 30, and December 31, 2026.
The dividend decision comes as LTC Properties trades at US$42.46. The share price has a 7.03% 90-day return and a 22.54% year-to-date return. The 1-year total shareholder return of 31.53% indicates momentum that extends over several years, supported by 3-year and 5-year total shareholder returns of 59.26% and 70.12% respectively.
Scan income-focused opportunities beyond LTC Properties by checking our curated list of 8 dividend fortresses that pair yield potential with substantial underlying businesses.
Bulls point to LTC Properties’ long dividend history and recent share price strength. Bears highlight pressured net income. Which case does the current valuation support next?
Most Popular Narrative: 7.7% Undervalued
LTC Properties closed at $42.46 against a widely followed fair value estimate of $46.00, so the narrative leans modestly in favor of undervaluation while hinging heavily on how the senior housing shift plays out.
The main thing that has to go right is LTC Properties executing its accelerated SHOP expansion and platform build, including meeting its acquisition and NOI targets while keeping leverage within its stated range and managing slightly softer than planned occupancy.
The build out of LTC Properties’ SHOP operating and data platform, including a wider roster of regional operators and investment in asset management and analytics, is intended to support low to mid teens targeted acquisition returns and double digit core SHOP NOI growth.
See why 48 investors see LTC Properties as 8% undervalued.
Result: Fair Value of $46 (UNDERVALUED)
Still, flat core FFO per share, softer than targeted SHOP occupancy, and equity issuance that dilutes per share earnings all have the potential to pressure the LTC Properties story.
Find out about the key risks to this LTC Properties narrative.
Another View: What The P/E Says About LTC Properties
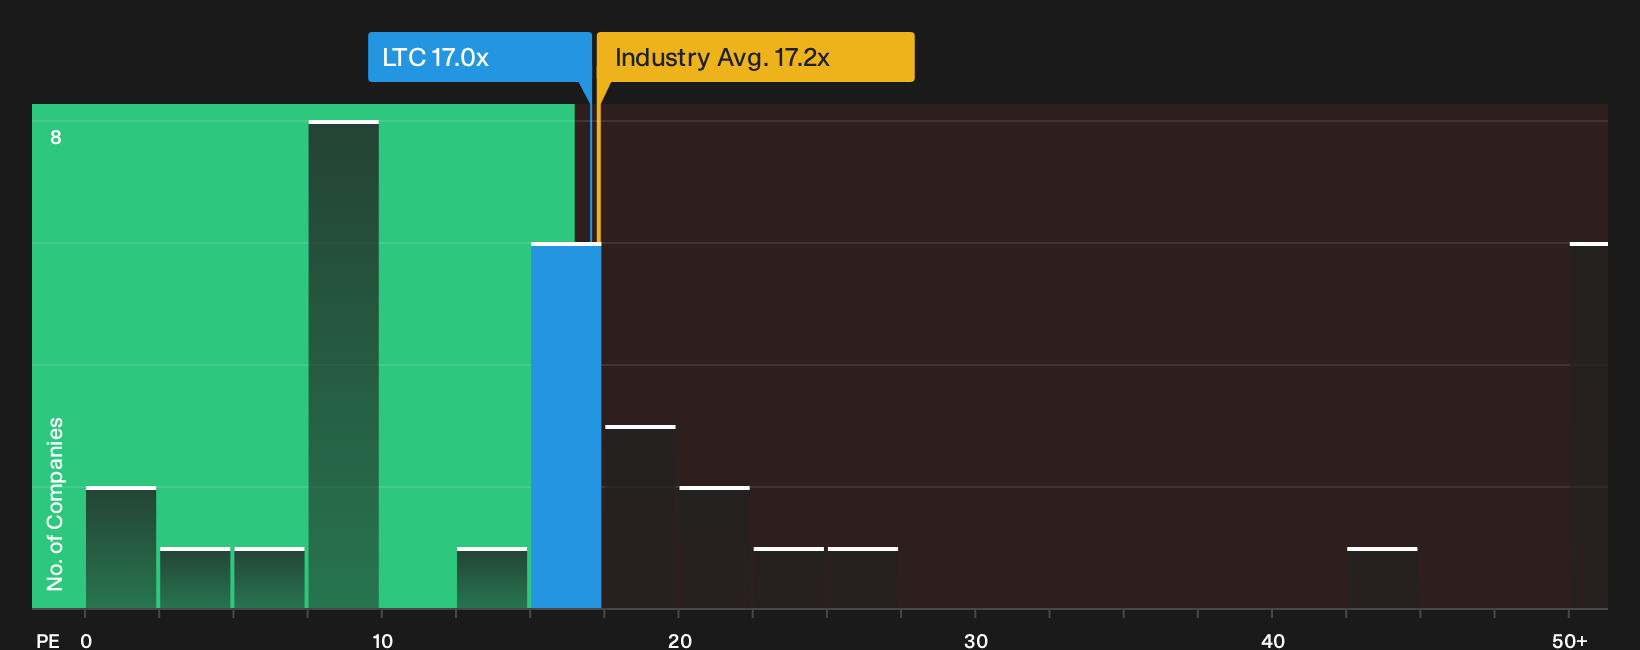
The earlier fair value story paints LTC Properties as 7.7% undervalued. On simple P/E, the picture is more restrained. LTC trades around 17x earnings, almost identical to the global Health Care REITs average of 16.9x, so the share price looks close to the sector norm rather than clearly discounted.
Peer comparisons tell a different story, though. Against a peer average P/E of 34.7x and a fair ratio estimate of 26.5x, LTC’s 17x multiple looks materially lower. That gap can indicate valuation risk if earnings fade or a potential upside if results remain stable. Which side of that trade do you think current fundamentals justify next.
See what the numbers say about this price — find out in our valuation breakdown.
Next Steps
Mixed messages on LTC Properties so far. Pricing, income prospects, risks, and potential rewards are all in tension, which is exactly why you should walk through the detail and stress test the thesis yourself through 3 key rewards and 5 important warning signs.
Looking for more investment ideas beyond LTC Properties?
Do not stop with LTC Properties. The market is full of other potential opportunities that could fit your goals just as well or even better.
- Target resilient compounders by scanning a 31 resilient stocks with low risk scores that prioritises balance sheet strength and steadier risk profiles.
- Spot potential mispricings by running through a 28 high quality undervalued stocks that highlights companies combining quality fundamentals with pricing that may not fully reflect them.
- Build a stronger income stream by reviewing a 8 dividend fortresses that focuses on higher yields backed by more substantial businesses.
This article by Simply Wall St is general in nature. We provide commentary based on historical data and analyst forecasts only using an unbiased methodology and our articles are not intended to be financial advice. It does not constitute a recommendation to buy or sell any stock, and does not take account of your objectives, or your financial situation. We aim to bring you long-term focused analysis driven by fundamental data. Note that our analysis may not factor in the latest price-sensitive company announcements or qualitative material. Simply Wall St has no position in any stocks mentioned.
Have feedback on this article? Concerned about the content? Get in touch with us directly. Alternatively, email editorial-team@simplywallst.com