
Is Burke & Herbert Financial Services (BHRB) Expensive On Its $100 Million Notes Offering?
Burke & Herbert Financial Services (BHRB) has just completed a $100 million fixed to floating rate notes offering due 2036. This move reshapes its funding mix and interest rate exposure.
Recent trading has been softer, with the share price slipping over the past month and quarter, yet Burke & Herbert Financial Services still shows an 11.51% year to date share price return and a 23.69% 1 year total shareholder return. This signals momentum that has cooled in the short term but remains solid over a longer window as this new $100 million subordinated debt sits alongside that performance.
Scan other regional banks with similar capital strength and balance sheet quality using our hand picked list of solid balance sheet and fundamentals (25 results) as a comparison point for Burke & Herbert Financial Services.
Short term weakness, fresh subordinated debt and a long record of total return all meet at today’s US$68.88 share price. Is this the moment to step in or wait for a cleaner entry before Burke & Herbert Financial Services’ valuation case is clear?
Price-to-Earnings of 14.5x: Is it justified?
Valuation on Burke & Herbert Financial Services currently hinges on a P/E of 14.5x at a $68.88 share price. This places the stock above both bank peers and the wider US market benchmark it has outperformed over the past year.
The P/E ratio compares what investors are paying for each dollar of earnings. For a regional bank like Burke & Herbert Financial Services, it reflects what the market is willing to pay for the current profit profile, alongside expectations for how those profits might change over time.
Here, the picture is mixed. On one hand, BHRB is described as expensive versus both its direct peers at 14.2x and the broader US Banks industry at 11.4x. On the other hand, the same P/E of 14.5x is framed as below the US market level of 18x and also below an estimated fair P/E of 19.9x that the market could move towards if sentiment or fundamentals support it.
Result: Price-to-Earnings of 14.5x (ABOUT RIGHT)
Explore the SWS fair ratio for Burke & Herbert Financial Services.
Still, Burke & Herbert Financial Services faces clear pressure points if funding costs stay elevated or if loan credit quality weakens and erodes that earnings base.
Find out about the key risks to this Burke & Herbert Financial Services narrative.
Another View: Our DCF Model Says BHRB Looks Rich
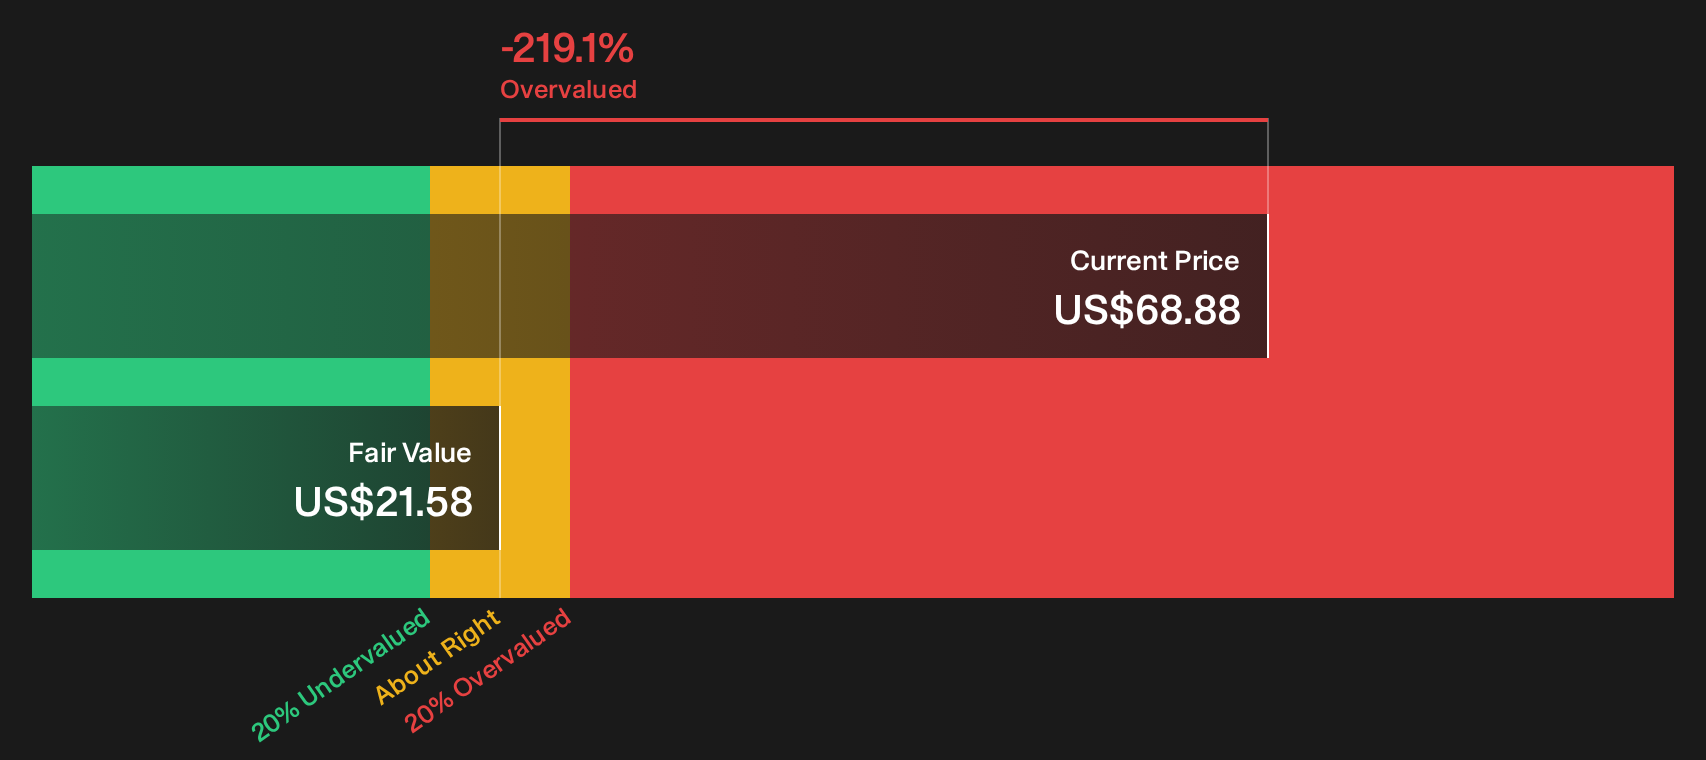
P/E suggests Burke & Herbert Financial Services is roughly in the right zone, but the SWS DCF model tells a different story. On that measure, BHRB at $68.88 trades well above an estimated future cash flow value of $21.58, which points to an overvalued stock. Which signal do you treat as the anchor?
Look into how the SWS DCF model arrives at its fair value.
Simply Wall St performs a discounted cash flow (DCF) on every stock in the world every day (check out Burke & Herbert Financial Services for example). We show the entire calculation in full. You can track the result in your watchlist or portfolio and be alerted when this changes, or use our stock screener to discover 29 high quality undervalued stocks. If you save a screener we even alert you when new companies match - so you never miss a potential opportunity.
Next Steps
Mixed signals on Burke & Herbert Financial Services so far, right, with both pressure points and bright spots in the story. If you want to move quickly and build your own conviction rather than lean on any single model or ratio, weigh up the 3 key rewards and 4 important warning signs.
Looking for more Burke & Herbert Financial Services sized opportunities?
If Burke & Herbert Financial Services has caught your eye, do not stop here. Use fresher ideas from targeted screeners to keep your watchlist a step ahead.
- Start with quality and value, then scan a curated set of 29 high quality undervalued stocks that combine fundamentals with potential mispricing.
- Prioritise resilience first, then filter through 31 resilient stocks with low risk scores that aim to keep portfolio volatility in check.
- Hunt for tomorrow's potential leaders by reviewing 20 high quality undiscovered gems that sit off most investors' radars today.
This article by Simply Wall St is general in nature. We provide commentary based on historical data and analyst forecasts only using an unbiased methodology and our articles are not intended to be financial advice. It does not constitute a recommendation to buy or sell any stock, and does not take account of your objectives, or your financial situation. We aim to bring you long-term focused analysis driven by fundamental data. Note that our analysis may not factor in the latest price-sensitive company announcements or qualitative material. Simply Wall St has no position in any stocks mentioned.
Have feedback on this article? Concerned about the content? Get in touch with us directly. Alternatively, email editorial-team@simplywallst.com