
3 Undervalued Small Caps In Global With Notable Insider Transactions
In recent weeks, global markets have experienced volatility due to geopolitical tensions in the Middle East, fluctuating energy prices, and mixed performances across major indices like the S&P 500 and Russell 2000. Amidst these dynamics, small-cap stocks are drawing attention as investors seek opportunities that may be overlooked by broader market trends. Identifying promising small-cap stocks often involves looking for those with solid fundamentals and notable insider transactions, which can signal confidence from those closest to the company’s operations.
Top 10 Undervalued Small Caps With Insider Buying Globally
| Name | PE | PS | Discount to Fair Value | Value Rating |
|---|---|---|---|---|
| Q Technology (Group) | 3.4x | 0.2x | 44.84% | ★★★★★☆ |
| China Aircraft Leasing Group Holdings | 7.1x | 0.9x | 37.65% | ★★★★★☆ |
| Diversified Royalty | 25.4x | 10.1x | 46.02% | ★★★★☆☆ |
| Franchise Brands | 27.4x | 2.0x | 47.02% | ★★★★☆☆ |
| Yellow Pages | 8.4x | 0.8x | 29.06% | ★★★☆☆☆ |
| Citicore Energy REIT | 13.4x | 10.2x | 25.72% | ★★★☆☆☆ |
| Centurion | 17.1x | 3.3x | 16.12% | ★★★☆☆☆ |
| Travis Perkins | NA | 0.3x | -197.20% | ★★★☆☆☆ |
| Linc | 11.8x | 12.3x | 35.86% | ★★★☆☆☆ |
| Coveo Solutions | NA | 2.0x | -4.94% | ★★★☆☆☆ |
Let's dive into some prime choices out of from the screener.
PZ Cussons (LSE:PZC)
Simply Wall St Value Rating: ★★★☆☆☆
Overview: PZ Cussons is a consumer goods company involved in the manufacturing and distribution of personal care, home care, and beauty products across various regions including Africa, Asia Pacific, Europe & The Americas with a market capitalization of approximately £1.03 billion.
Operations: The company's revenue streams are primarily derived from its operations across Africa (£168 million), Asia Pacific (£176.4 million), and Europe & The Americas (£202.2 million). Over recent periods, the gross profit margin has shown variability, with a recent figure of 40.52%. Operating expenses include significant allocations to sales and marketing, as well as general and administrative costs.
PE: 20.5x
PZ Cussons, a company with a market presence in personal care products, has shown promising financial recovery. For the year ending May 31, 2026, sales rose to £541.4 million from £513.8 million the previous year, while net income improved significantly to £19.8 million from a loss of £5.8 million. Despite recent executive changes and reliance on external borrowing for funding, insider confidence is evident through share purchases in recent months. The forecasted annual earnings growth of 17% suggests potential for future expansion amidst its current valuation challenges.
- Navigate through the intricacies of PZ Cussons with our comprehensive valuation report here.
Evaluate PZ Cussons' historical performance by accessing our past performance report.
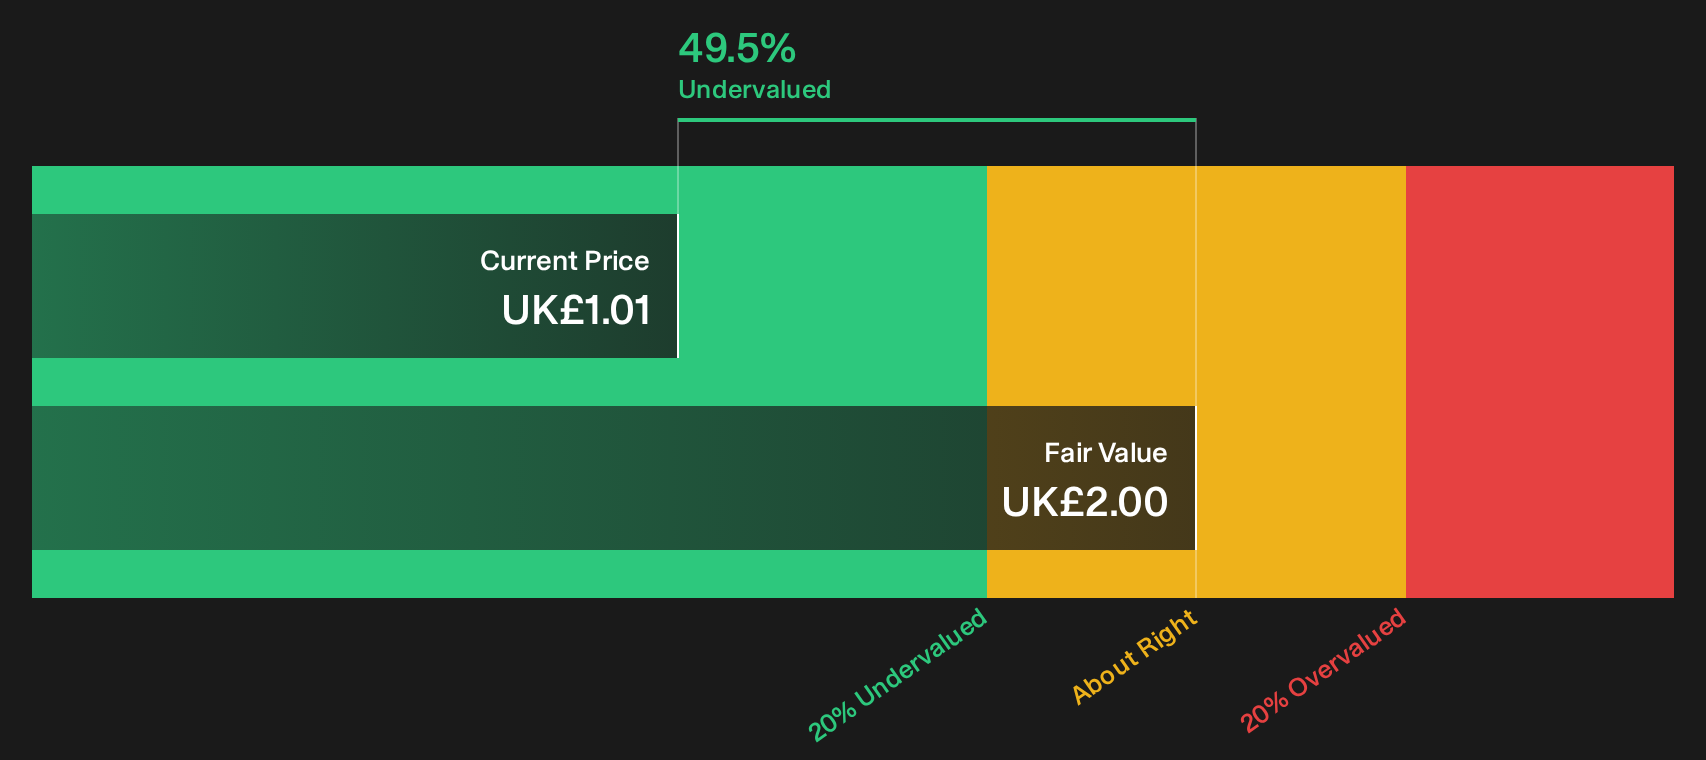
Nyab (OM:NYAB)
Simply Wall St Value Rating: ★★★☆☆☆
Overview: Nyab operates in the consulting and civil engineering sectors, with a focus on providing services in these areas, and has a market capitalization of €1.2 billion.
Operations: Nyab generates revenue primarily through its Consulting and Civil Engineering segments, with the latter contributing significantly more. The company's cost of goods sold (COGS) impacts its gross profit, which shows a varying trend with a gross profit margin reaching up to 24.64%. Operating expenses include significant general and administrative costs, while non-operating expenses also play a role in financial outcomes. Notably, net income margins have fluctuated over recent periods, reflecting changes in profitability dynamics.
PE: 19.3x
Nyab's recent inclusion in the S&P Global BMI Index highlights its growing market presence. The company secured a significant SEK 1.6 billion contract with Svenska kraftnät for Phase 2 of the Letsi-Svartbyn project, enhancing Sweden's power infrastructure. Earnings rose notably, with Q2 sales hitting €161.9 million and net income doubling from last year to €7.73 million. Insider confidence is evident as Johan Larsson increased their stake by 111,000 shares in September 2026, signaling potential growth optimism amidst its higher-risk external funding strategy.
- Delve into the full analysis valuation report here for a deeper understanding of Nyab.
Explore historical data to track Nyab's performance over time in our Past section.
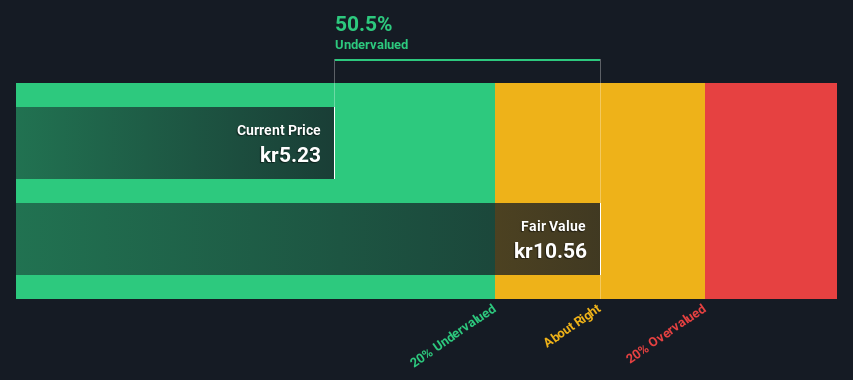
Shanghai Chicmax Cosmetic (SEHK:2145)
Simply Wall St Value Rating: ★★★★★☆
Overview: Shanghai Chicmax Cosmetic is involved in the manufacture and sale of cosmetic products, with a market capitalization of CN¥5.63 billion.
Operations: The company generates revenue primarily from the manufacture and sale of cosmetic products, with a recent revenue figure of CN¥8.83 billion. The gross profit margin has shown an upward trend, reaching 76.81% in the latest period. Sales and marketing expenses represent a significant portion of operating costs, indicating a focus on promoting their products heavily.
PE: 10.8x
Shanghai Chicmax Cosmetic, a smaller player in the cosmetics industry, is drawing attention due to insider confidence. Independent Non-Executive Director Yan Luo's recent purchase of 363,600 shares for CNY 27.4 million signals strong belief in the company's potential. Despite a dip in net income from CNY 524 million to CNY 108 million for the half year ending June 2026, strategic investments and share repurchase plans hint at future growth opportunities.

Where To Now?
- Click through to start exploring the rest of the 119 Undervalued Global Small Caps With Insider Buying now.
- Hold shares in these firms? Setup your portfolio in Simply Wall St to seamlessly track your investments and receive personalized updates on your portfolio's performance.
- Invest smarter with the free Simply Wall St app providing detailed insights into every stock market around the globe.
Contemplating Other Strategies?
- Explore high-performing small cap companies that haven't yet garnered significant analyst attention.
- Fuel your portfolio with companies showing strong growth potential, backed by optimistic outlooks both from analysts and management.
- Find companies with promising cash flow potential yet trading below their fair value.
This article by Simply Wall St is general in nature. We provide commentary based on historical data and analyst forecasts only using an unbiased methodology and our articles are not intended to be financial advice. It does not constitute a recommendation to buy or sell any stock, and does not take account of your objectives, or your financial situation. We aim to bring you long-term focused analysis driven by fundamental data. Note that our analysis may not factor in the latest price-sensitive company announcements or qualitative material. Simply Wall St has no position in any stocks mentioned.
Have feedback on this article? Concerned about the content? Get in touch with us directly. Alternatively, email editorial-team@simplywallst.com