
Berkshire Hathaway (BRK.B) Could Be 52% Undervalued After Buffett’s Final Letter
Warren Buffett’s final shareholder letter at Berkshire Hathaway (BRK.B) set a clear tone for life after his tenure, stressing long time horizons, durable competitive advantages and a succession plan he says leaves the group in “excellent hands.”
Recent trading has been calm rather than euphoric, with Berkshire Hathaway’s share price at US$517.60 after a 5.4% 90 day share price return. The 3 year total shareholder return of 49.5% shows how patient holders have been rewarded.
Scan Berkshire Hathaway’s wider peer set by zeroing in on financially resilient compounders using our curated screener of 31 resilient stocks with low risk scores that fit a long-term, Buffett-style mindset.
Berkshire Hathaway now trades near record territory after a solid multi year run and a fresh 90 day gain of 5.4%. Does that recent climb still leave enough upside to justify the risk for new buyers?
Price-to-Earnings of 12.9x: Is it justified?
Berkshire Hathaway trades on a P/E of 12.9x while our data shows the stock changing hands at $517.60 and screened as good value versus peers. That combination puts the focus squarely on whether the market is underestimating the group’s earnings power or correctly bracketing its prospects.
The P/E ratio compares what investors pay for each dollar of current profit and it is a common yardstick for diversified financial groups. A lower P/E can signal that investors are cautious about future results or that the market is offering a cheaper entry point relative to current earnings.
For Berkshire Hathaway, the current 12.9x P/E sits well below the US Diversified Financial industry average of 17x and under the peer average of 23.2x. It also screens as attractive against an estimated fair P/E of 14.7x, which may be of interest to investors who compare current sentiment with that reference point.
Explore the SWS fair ratio for Berkshire Hathaway.
Result: Price-to-Earnings of 12.9x
Still, Berkshire Hathaway’s story faces real pressure points, including any sustained weakness in insurance profitability, as well as regulatory or capital demands on its large utility operations.
Find out about the key risks to this Berkshire Hathaway narrative.
Another view on Berkshire Hathaway’s value
The first look at Berkshire Hathaway focused on its 12.9x P/E, which screens as cheap against peers. A second lens tells a different story. The SWS DCF model estimates future cash flows support a value of $786.71 per share, compared with the current $517.60 price.
That gap suggests the market price lags the cash flow estimate by a wide margin, even though analysts expect earnings to decline by 8.9% per year over the next 3 years. Is the cash flow model giving too much credit to Berkshire Hathaway’s earning power, or is the market applying an extra safety cushion?
Look into how the SWS DCF model arrives at its fair value.
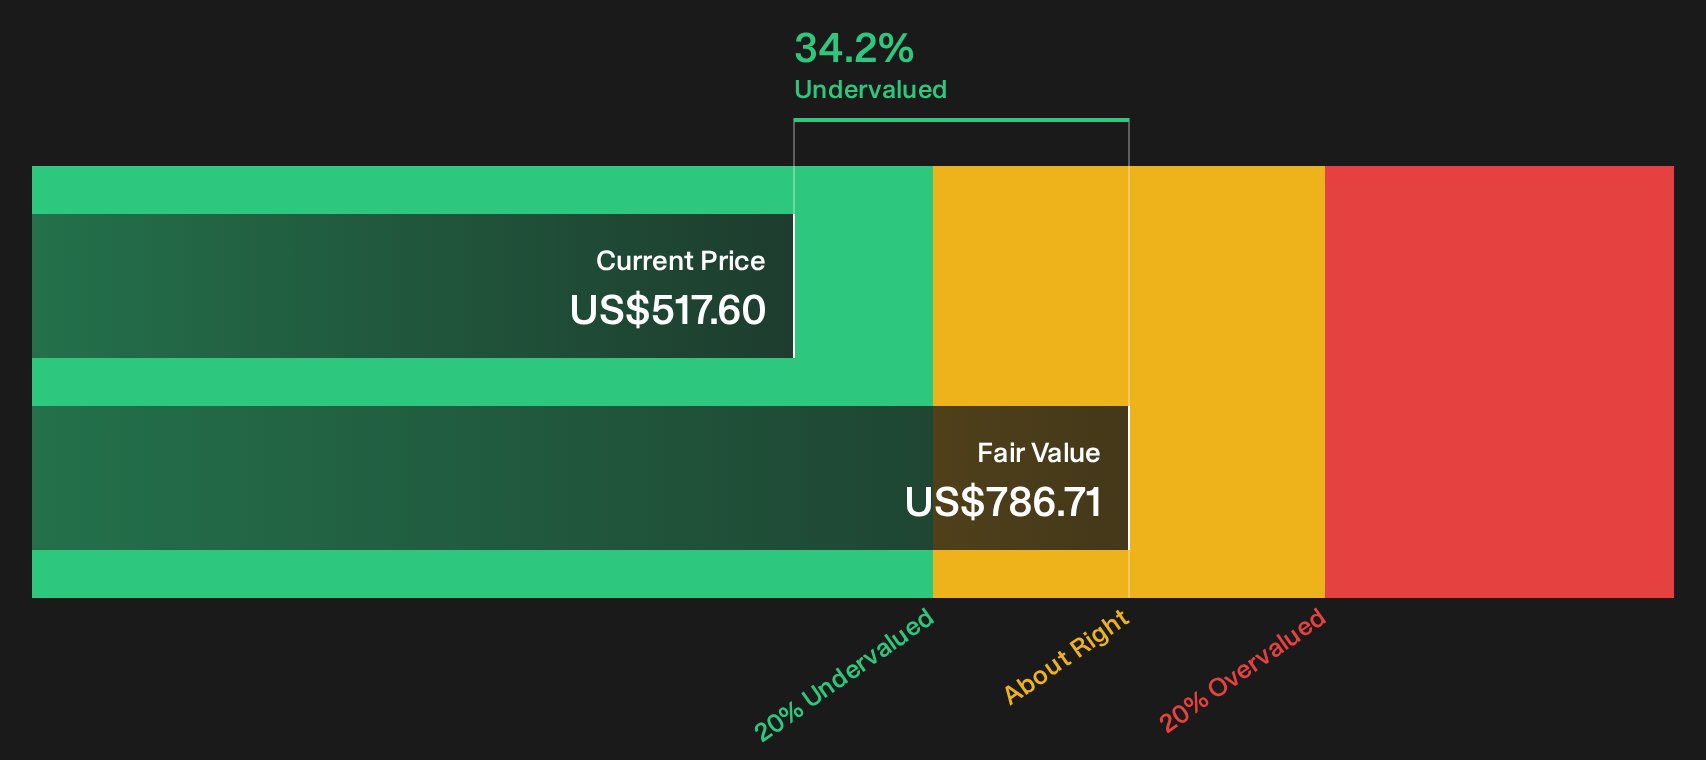
Simply Wall St performs a discounted cash flow (DCF) on every stock in the world every day (check out Berkshire Hathaway for example). We show the entire calculation in full. You can track the result in your watchlist or portfolio and be alerted when this changes, or use our stock screener to discover 29 high quality undervalued stocks. If you save a screener we even alert you when new companies match - so you never miss a potential opportunity.
Next Steps
Mixed signals around Berkshire Hathaway’s valuation and outlook create a genuine fork in the road. Move quickly, review the full data set and weigh the 3 key rewards and 1 important warning sign
Looking for more investment ideas beyond Berkshire Hathaway?
If Berkshire Hathaway sharpened your focus on quality and price, do not stop here. Broader opportunities often sit just outside your current watchlist.
- Target deep value by scanning 29 high quality undervalued stocks where strong fundamentals and lower valuations intersect for investors willing to do the work.
- Strengthen your capital base by reviewing the list of solid balance sheet and fundamentals (25 results) which can help cushion portfolios when conditions turn harder.
- Get ahead of the crowd by tracking 20 high quality undiscovered gems before attention and liquidity potentially shift their way.
This article by Simply Wall St is general in nature. We provide commentary based on historical data and analyst forecasts only using an unbiased methodology and our articles are not intended to be financial advice. It does not constitute a recommendation to buy or sell any stock, and does not take account of your objectives, or your financial situation. We aim to bring you long-term focused analysis driven by fundamental data. Note that our analysis may not factor in the latest price-sensitive company announcements or qualitative material. Simply Wall St has no position in any stocks mentioned.
Have feedback on this article? Concerned about the content? Get in touch with us directly. Alternatively, email editorial-team@simplywallst.com