
Orient Overseas International (SEHK:316) Looks Fully Valued Following Strong Q3 Operating Growth
Orient Overseas (International) (SEHK:316) just released unaudited operating figures for the third quarter of 2026. The company highlighted sharp gains in liner revenue, liftings, and average revenue per TEU versus the prior year.
Recent price action suggests investors are reacting positively to the stronger operating update. The share price is now HK$165.0 after a 29.92% year to date share price return, while the 5 year total shareholder return of 208.09% indicates momentum that has been building over a longer period.
Spot emerging trends behind Orient Overseas (International) and other transport and logistics plays by scanning our hand picked list of solid balance sheet and fundamentals (203 results).After a 30% year to date gain and a strong third quarter update, the real debate on Orient Overseas (International) now centers on upside still ahead versus most of it already in the rearview mirror. The valuation work comes next.
Price-to-Earnings of 10.8x: Is it justified for Orient Overseas (International)?
On simple earnings terms, Orient Overseas (International) trades on a P/E of 10.8x, which puts the HK$165.0 share price slightly below the Asian shipping industry average but above the level suggested by some fair value models. That mix indicates the market is not paying a premium for the recent momentum, yet it is also not treating the ticker as a deep value outlier.
The P/E ratio compares what investors pay today for each unit of current earnings. For a container shipping and logistics group like Orient Overseas (International), it gives a quick read on how the market is pricing a business tied closely to global trade volumes, freight rates, and capital intensive assets.
Against peers, the picture is split. The current 10.8x P/E is lower than both the Asian shipping industry average of 11.6x and the peer group average of 12.3x. This points to a discount relative to similar operators. At the same time, the estimated fair P/E of 6.2x is far lower. This strongly suggests the multiple could be rich if earnings trends and quality do not improve toward that benchmark level the market could move towards.
Explore the SWS fair ratio for Orient Overseas (International).
Result: Price-to-Earnings of 10.8x (OVERVALUED)
Still, Orient Overseas (International) faces risk if global trade volumes soften or freight rates weaken, which could pressure earnings and challenge the current P/E narrative.
Find out about the key risks to this Orient Overseas (International) narrative.
Another View on Orient Overseas (International)'s Value
The P/E check paints Orient Overseas (International) as expensive versus an estimated fair ratio. A different lens, the SWS DCF model, points the same way. At HK$165, the share price sits above an assessed future cash flow value of HK$119.25, which raises a simple question: how much optimism is already in the price?
Look into how the SWS DCF model arrives at its fair value.
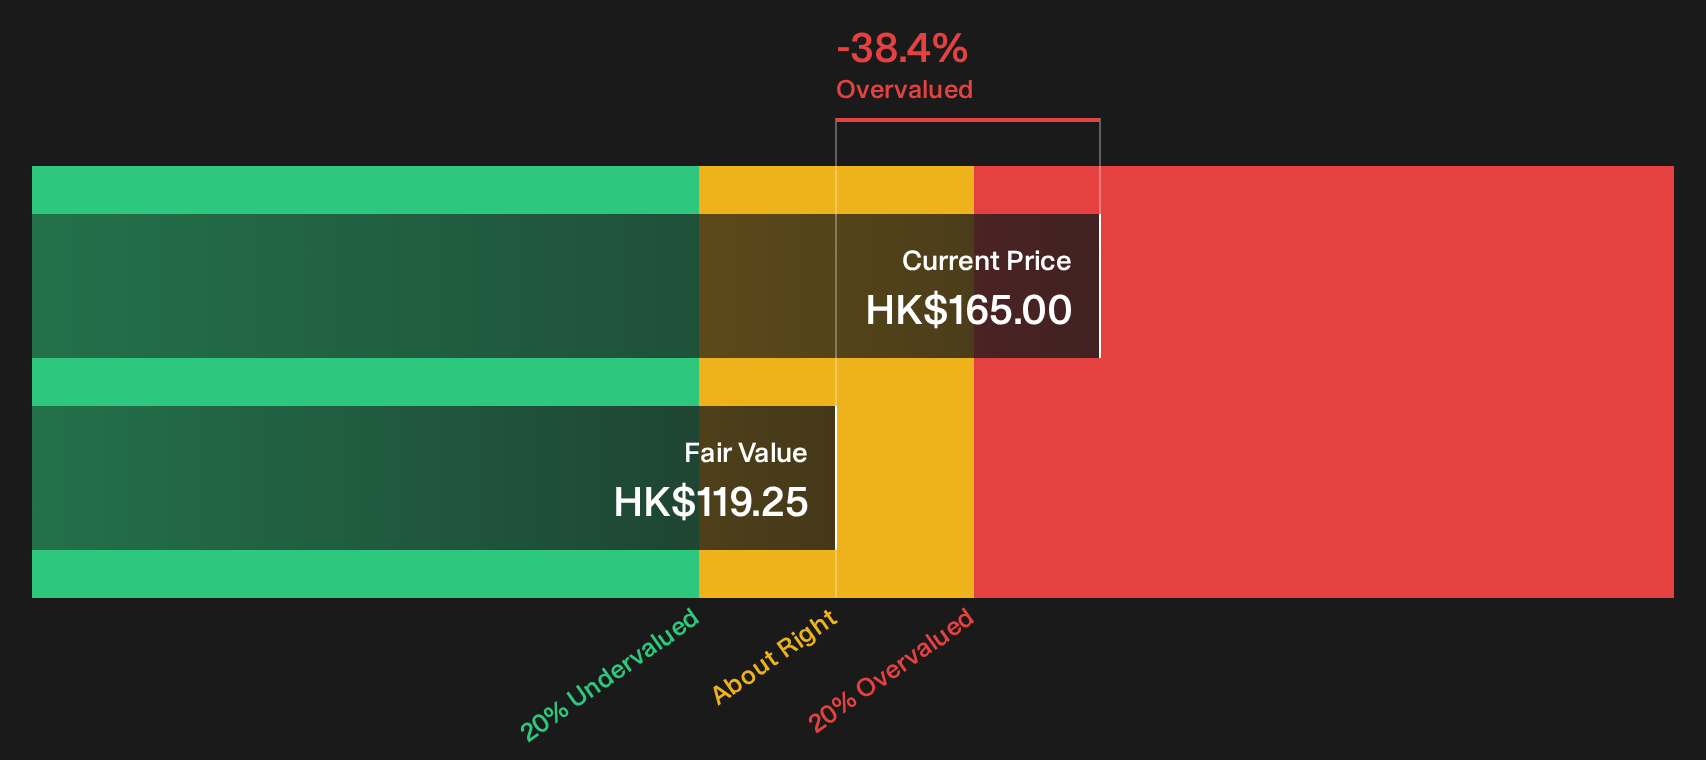
Simply Wall St performs a discounted cash flow (DCF) on every stock in the world every day (check out Orient Overseas (International) for example). We show the entire calculation in full. You can track the result in your watchlist or portfolio and be alerted when this changes, or use our stock screener to discover 182 high quality undervalued stocks. If you save a screener we even alert you when new companies match - so you never miss a potential opportunity.
Next Steps
If this Orient Overseas (International) update leaves you unsure whether optimism or caution should dominate, quickly review the underlying data yourself, including the 4 important warning signs.
Looking for more investment ideas beyond Orient Overseas (International)?
Do not stop your research with one stock. Broaden your watchlist using focused screeners that surface different types of opportunities across the market.
- Target potential mispricing by scanning companies that combine quality and attractive valuations through the 182 high quality undervalued stocks.
- Build a steadier income stream by reviewing businesses with robust payout profiles using the 219 dividend fortresses.
- Reduce portfolio shocks by filtering for businesses with stronger financial resilience through the 225 resilient stocks with low risk scores.
This article by Simply Wall St is general in nature. We provide commentary based on historical data and analyst forecasts only using an unbiased methodology and our articles are not intended to be financial advice. It does not constitute a recommendation to buy or sell any stock, and does not take account of your objectives, or your financial situation. We aim to bring you long-term focused analysis driven by fundamental data. Note that our analysis may not factor in the latest price-sensitive company announcements or qualitative material. Simply Wall St has no position in any stocks mentioned.
Have feedback on this article? Concerned about the content? Get in touch with us directly. Alternatively, email editorial-team@simplywallst.com