
Can Guardant Health (GH) Justify Its Valuation As COSMOS MEL01 Data Strengthens Reveal?
Guardant Health (GH) is back in focus after new COSMOS-MEL01 data showed its Guardant Reveal blood test picked up molecular residual disease and melanoma recurrence with high specificity and sensitivity in resected stage II-III patients.
Guardant Health’s share price has pulled back, with a 1-day share price return of 2.79% and a 7-day share price return of 13.05% after this update. However, momentum over a longer stretch remains positive, with a year-to-date share price return of 60.01% and a 1-year total shareholder return of 163.71%, suggesting investors have been steadily reassessing both growth potential and execution risk as new clinical data and product developments emerge.
Scan other oncology-focused opportunities moving on similar clinical catalysts by running the curated 33 healthcare AI stocks alongside Guardant Health.
Guardant Health looks like a strong cancer testing platform, and the latest melanoma data adds more weight to that story. After a sharp rerating, is the current share price still offering sensible value?
Most Popular Narrative: 18% Undervalued
Guardant Health last closed at $162.79, while the most widely followed narrative pegs fair value around $199.04, leaving a sizeable gap that hinges on how its testing portfolio scales and margins improve.
Substantial regulatory, reimbursement, and clinical validation milestones (including Shield's breakthrough device status, NCCN guideline inclusion, and ongoing pilot studies) are paving the way for further guideline adoption, expanded payer coverage, and commercial inflections in Shield/MCED and Reveal volumes, which significantly increases future revenue and earnings visibility.
See why 22 investors see Guardant Health as 18% undervalued.
Result: Fair Value of $199.04 (UNDERVALUED)
Still, the bullish Guardant Health narrative could be knocked off course if high cash burn forces fresh capital raises or if payer adoption and reimbursement for Shield roll out more slowly than analysts expect.
Find out about the key risks to this Guardant Health narrative.
Another View: Pricing Guardant Health Off Sales
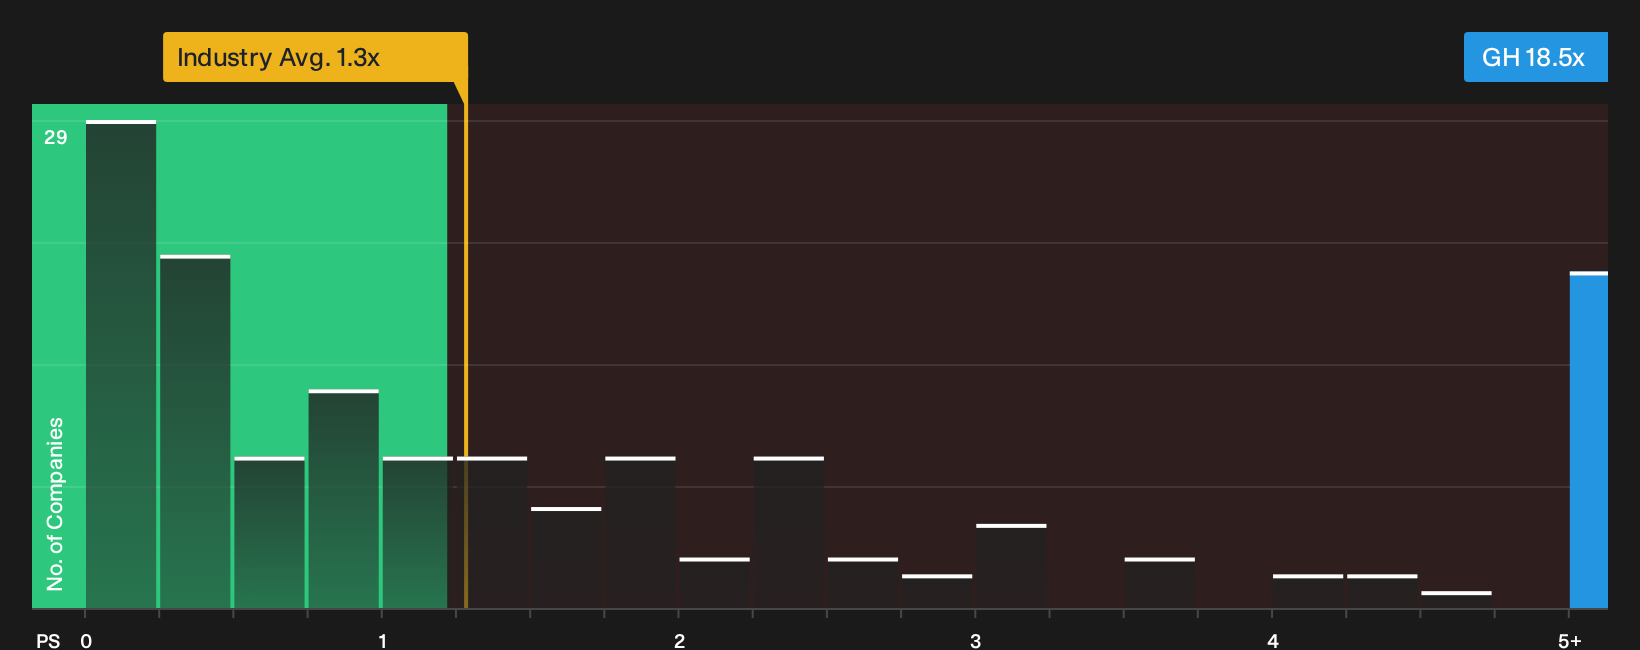
The earlier narrative leans on analyst forecasts and fair value targets that suggest Guardant Health looks undervalued. A very different picture emerges when you look at the P/S ratio. GH trades on 18.5x sales compared with 1.3x for the wider US Healthcare sector and 1.4x for peers, while the fair ratio sits at 9.2x.
That gap implies investors are already paying a heavy premium for future execution, far above where the broader group and the fair ratio suggest the multiple could settle. The question for anyone running the numbers is simple: How confident are you that Guardant Health can grow into this price before sentiment cools?
See what the numbers say about this price — find out in our valuation breakdown.
Next Steps
Mixed about the tone of this Guardant Health story so far? Put the numbers in context, weigh the clinical upside against the financial pressure, then check the 3 key rewards and 2 important warning signs.
Looking for more Guardant Health style ideas?
If Guardant Health has sharpened your thinking on risk, reward, and pricing power, do not stop here. Broader idea hunting raises your odds of finding the next outlier.
- Target fresh upside by scanning the 20 high quality undiscovered gems that rarely appear on crowded watchlists.
- Prioritise resilience first and shortlist the 31 resilient stocks with low risk scores that score well on stability.
- Strengthen your core holdings by reviewing a list of solid balance sheet and fundamentals (25 results) that can better handle shocks.
This article by Simply Wall St is general in nature. We provide commentary based on historical data and analyst forecasts only using an unbiased methodology and our articles are not intended to be financial advice. It does not constitute a recommendation to buy or sell any stock, and does not take account of your objectives, or your financial situation. We aim to bring you long-term focused analysis driven by fundamental data. Note that our analysis may not factor in the latest price-sensitive company announcements or qualitative material. Simply Wall St has no position in any stocks mentioned.
Have feedback on this article? Concerned about the content? Get in touch with us directly. Alternatively, email editorial-team@simplywallst.com