
Vivmark Residential (VMRK) On Development Pipeline Hopes And Why Valuation Is Back In Focus
Vivmark Residential (VMRK) drew fresh attention after recent price moves left the share price at US$61.25. Returns over the past month and past 3 months show a mixed performance profile for the stock.
Viewed over a longer stretch, Vivmark Residential now sits only slightly below its year to date share price level, with a 1-year total shareholder return of 3.34% that includes dividends. Recent weakness, including a 30-day share price return down 6.55% and a 90-day share price return down 10.87%, signals fading momentum as investors reassess growth potential and risk around the current US$61.25 price point.
Spot opportunities beyond Vivmark Residential's recent pullback by scanning our hand picked 29 high quality undervalued stocks, which combines solid fundamentals with compressed expectations.Vivmark Residential now trades almost US$12 below the average analyst target and at a much steeper gap to some intrinsic value estimates. Is that discount justified by fundamentals or mispricing on recent weakness?
Most Popular Narrative: 18% Undervalued
Vivmark Residential's most followed valuation storyline points to a fair value of $74.40, above the last close at $61.25. This frames the recent pullback as a potential disconnect between price and the longer term thesis built around supply, demand and development returns.
A US$3.5b development pipeline under construction with projected initial stabilized yields of 6.3% and a funding cost of 4.9% is expected to lift development NOI from US$47 million in 2026 to US$120 million in 2027, which is intended to grow total NOI and future earnings.
See why 2 investors see Vivmark Residential as 18% undervalued.
This narrative applies a 7.31% discount rate to analysts' forecasts and lands on that $74.40 fair value, which implies Vivmark Residential trades at about an 18% discount today. The story leans on tight occupancy, a development pipeline with yields above funding costs, and capital recycling into higher returning projects and buybacks to support future cash flow and earnings quality over time.
Analysts in this framework assume revenue of $3.4b and earnings of $760.1m by 2029, with a future P/E of 17.4x on those earnings, compared with a current industry P/E of 35.8x for US Residential REITs. For the market price to converge toward this fair value, investors would need to be comfortable with that lower margin profile, modest earnings path and the idea that a 17.4x multiple on 2029 earnings is a reasonable end point for Vivmark Residential.
Result: Fair Value of $74.40 (UNDERVALUED)
Still, this Vivmark Residential storyline hinges on earnings holding near current levels and on development yields staying above funding costs, both of which could be pressured by weaker rental demand or rising expenses.
Find out about the key risks to this Vivmark Residential narrative.
Another View: Vivmark Residential Looks Pricey On Earnings
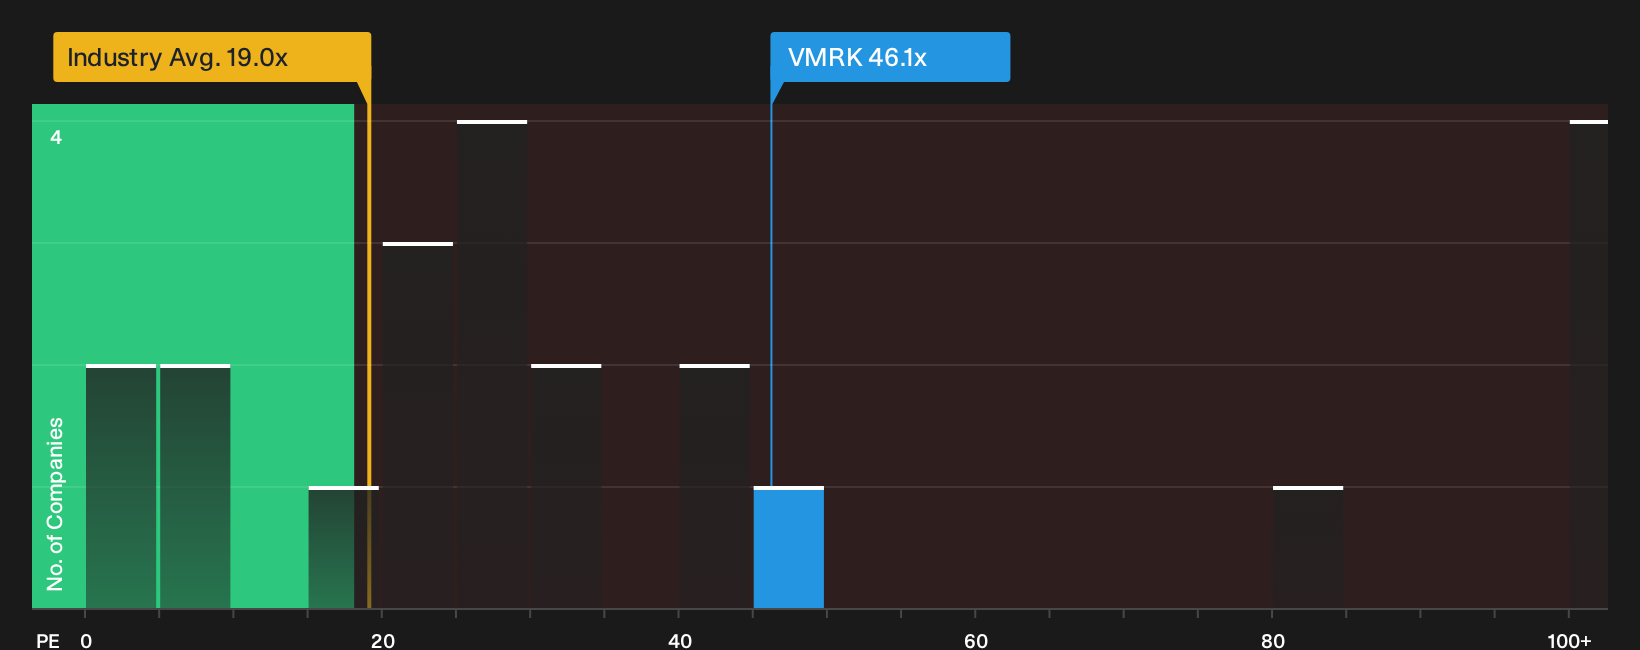
Look at Vivmark Residential through simple earnings multiples and the picture shifts. The stock trades on a P/E of 46.1x, compared with 18.1x for the global Residential REITs group and 31.9x for peers. The fair ratio is 35.2x, which points to valuation risk if sentiment cools.
That gap means you are paying a richer price tag than both the sector and the fair ratio the market could move toward, even while analysts expect only 9.5% yearly earnings growth and an 8.5% return on equity. Which version of value do you trust when the story and the sticker price diverge this much?
See what the numbers say about this price, find out in our valuation breakdown See what the numbers say about this price — find out in our valuation breakdown.
Next Steps
Mixed messages on Vivmark Residential's valuation story can be useful rather than confusing if you use them as a prompt to check the underlying figures yourself and move quickly from headline impressions to your own thesis. To weigh up both the concerns and the upside potential that other investors are watching, start with the 2 key rewards and 5 important warning signs.
Looking for more investment ideas beyond Vivmark Residential?
If Vivmark Residential has you thinking harder about price versus potential, do not stop there. Broaden your watchlist now so you are not late to the next opportunity.
- Spot compressed valuations early by scanning companies that currently screen as 29 high quality undervalued stocks with stronger fundamentals than their prices suggest.
- Prioritize resilience by focusing on a list of solid balance sheet and fundamentals (25 results) that can better handle funding costs, refinancing cycles, and tougher operating conditions.
- Hunt for off-the-radar opportunities using a curated 20 high quality undiscovered gems that couples quality metrics with lower market attention.
This article by Simply Wall St is general in nature. We provide commentary based on historical data and analyst forecasts only using an unbiased methodology and our articles are not intended to be financial advice. It does not constitute a recommendation to buy or sell any stock, and does not take account of your objectives, or your financial situation. We aim to bring you long-term focused analysis driven by fundamental data. Note that our analysis may not factor in the latest price-sensitive company announcements or qualitative material. Simply Wall St has no position in any stocks mentioned.
Have feedback on this article? Concerned about the content? Get in touch with us directly. Alternatively, email editorial-team@simplywallst.com